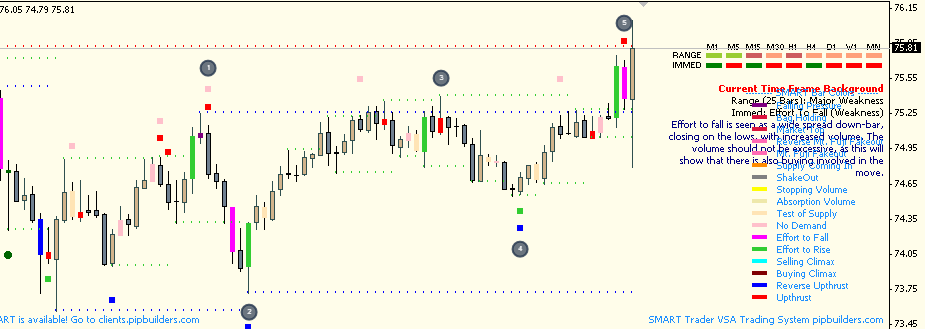
Many people in the live chat and pm’s ask how to correctly identify hidden selling and hidden buying and how to distinguish these patterns from similar patterns such as market top (which looks like hidden selling if not using SMART). The following screenshot is from the H1 Globex GBP and is illustrated in Real Time perfectly using SMART.
Text from screenshot:
Identifying Hidden Selling/Buying Using Volume Spread Analysis with SMART VSA
1. Valid Reverse Upthrust or Blue SMART Bar (strength)
2. Valid Upthrust or SMART VSA Spinning Rowboat SMART Firebrick Bar (Weakness)
3. Hidden Buying*
4. Looks like hidden buying but is actually a Market Top Indication or SMART Crimson Bar. (easy to see the differences using SMART just roll over it with your mouse)
5. Hidden Selling (Weakness)*
6. Hidden Buying (Strength)*
7. Hidden Selling (Weakness)*
Hidden Selling or Buying is seen as a Pseudo Upthrust after a widespread Downbar bar (Strength) or a Pseudo Reverse Upthrust following a widespread UP bar.
For the purposes of this example only the modules needed to illustrate hidden selling and hidden buying and the difference between those signals and other similar looking signals are shown.
Please keep in mind SMART Trader itself is painting these bars which makes these patterns and setups much easier to spot and act on.
These patterns repeat themselves day in and day out and using SMART you can clearly see not only standard VSA signals but our advanced multibar SMART VSA patterns as well.
Trade setups are verified using our proprietary background scanners (included with the system).
For more information or if you have any questions about SMART Trader Volume Spread Analysis (VSA) Software please visit
SMART Trader at pipbuilders.com or visit our Live and Free VSA (Volume Spread Analysis) Chat and Trading Room at http://vsa.pipbuilders.com
Good luck trading and see you in the chat.
I haven’t posted in a bit as we have been busy planning out some updates. A person in the live VSA chat asked that I post up a quick AUD CAD. Analysis is during what I call a dead zone (SMART Module coming soon) but I figured I would post it up here as well for those not in the chat. .
Hi all I am still on vacation (Back on Sunday or Monday) but have been trading very casually this week. Here is the requested chart on AUDJPY based on some private messages. Even though I was trading casually I was still able to pull in a very nice amount of pips on AJ alone using SMART VSA (Volume Spread Analysis) and Standard VSA. I am on my mini so annotation is light and the background and color guide areas are a bit jumbled… but take a look at the following chart. This chart is the Hourly AUDJPY

As many of you know from the live chat I have been away for a few weeks on vacation (hence the lack of updates). I will be back on Sunday evening and ready to roll. If you have any questions or need anything in the meantime just let me know via our ticket system or in the VSA chat.
As many of you know from the live chat I have been away for a few weeks on vacation (hence the lack of updates). I will be back on Sunday evening and ready to roll. If you have any questions or need anything in the meantime just let me know via our ticket system or in the VSA chat.