Monthly Archives: February 2011

Smart Volume Spread Analysis Software Signal to Signal Trading (GBP/USD)

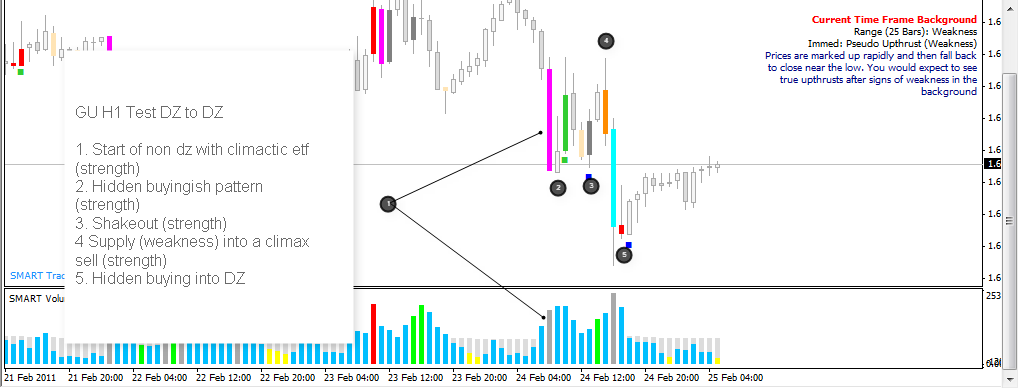
A quick chart detailing very simple signal to signal trading on GBP/USD from the end of one dead zone (no trade area) to the start of the next.  A simple one bar test (h1 test doc coming soon) was used as well for each entry.  You see this day in and day out very easily with SMART Volume Spread Analysis Software.


Please keep in mind that these examples are not cherry picked, the screenshots are real World examples selected from all of the charts I watch where the signal(s) and or concepts being discussed have appeared at the time this article was written.
 

2011-02-24_2319.png


Please also keep in mind SMART Trader itself is painting these bars which makes these patterns and setups much easier to spot and act on.  There is no guesswork,  if a signal is painted it is valid.


These patterns repeat themselves day in and day out and using SMART you can clearly see not only standard VSA signals but our advanced multibar SMART VSA patterns as well.
Trade setups are verified using our proprietary background scanners (included with the system).
For more information or if you have any questions about SMART Trader Volume Spread Analysis (VSA) Software please visit
SMART Trader at pipbuilders.com or visit our Live and Free VSA (Volume Spread Analysis) Chat and Trading Room at http://vsa.pipbuilders.com


Good luck trading and see you in the chat.


PS Check out our friends at TradeTakers (A social network for Traders)
Posted in Main

Multiple Time Frame Analysis Article Excerpt

An excerpt from an article written by the Great One regarding some common trading mistakes made by most non VSA (and even some VSA) traders.

Multiple Time Frame Analysis

In my years as a trading educator I have found that most losing traders have a critical glaring weakness in their approach to analyzing a market. The majority of their focus is placed on mathematical technical analysis tools such as moving average convergence divergence (MACD), the relative strength index (RSI) and/or stochastic studies (among many others). All of these types of tools are derivatives of price movement and are lagging indicators. To make matters worse, many of these traders attempt to use these tools in isolation and they completely lose focus on reality; indicators don’t move price, price movement moves indicators! Then the nail in the coffin occurs when the trader uses this approach on only one or two time frames (i.e. a 1- and 3-minute chart or a 5- and 15- minute chart).

The problem with this approach is the trader is not focused on why the price is moving in the first place. Price moves occur because there is an imbalance of supply/demand in the marketplace and this imbalance is created from the activity of professional traders. These professionals are very cagey when it comes to disguising their true intentions and hiding their positions from the uninformed retail trader. The average retail trader doesn’t understand how to read a chart in order to determine the underlying strength or weakness in the market. Even for a trained VSA expert, it is nearly impossible to accurately forecast the near-term direction of a market by analyzing a single time frame; there just isn’t enough corroborating evidence if we only look at one or two time frames. Think of each singular time frame as a musical note, when we combine multiple time frame’s together we go from the market blaring out one note noises, to the market singing us a melody and revealing the message that is so often hidden to the trader who can’t read a chart; that message is where the professional traders are positioned. 
Before we move to our chart examples we must understand the following rules of multiple time frame analysis:

  1. Each time frame can and will look structurally different from another.
  2. The smaller time frame will lead the larger time frame.
  3. The combination of activity on the smaller time frames summed together creates the structure of the larger time frames.`
  4. The larger the time frame showing strength/weakness the larger the impending move.
  5. We use the larger time frame to confirm the smaller time frame’s message; if there is no corroboration we have no confirmation.

If you would like to see the rest of the article let me know in the chat.

We also have some pretty big news from one of our good friends in the chat coming soon.
For more information or if you have any questions about SMART Trader Volume Spread Analysis (VSA) Software please visit 
SMART Trader at pipbuilders.com or visit our Live and Free VSA (Volume Spread Analysis) Chat and Trading Room at http://vsa.pipbuilders.com

Good luck trading and see you in the chat.
Posted in Main