Monthly Archives: April 2011

Beta For Real Time Volume Spread Analysis Trade Alerts Is Coming…

We had some issues with our beta VSA Real Time Trade Alerts signup page so please sign up again.  If you would like a notification of when it's ready, sign up at the following link: http://goo.gl/YnPl7

Thanks.

For more information or if you have any questions about SMART Trader Volume Spread Analysis (VSA) Software please visit 
SMART Trader at pipbuilders.com or visit our Live and Free VSA (Volume Spread Analysis) Chat and Trading Room at http://vsa.pipbuilders.com

If you would like to receive real time trade alerts sign up here

Good luck trading and see you in the chat.

PS Check out our friends at TradeTakers (A social network for Traders)

Posted in Main

SMART Volume Spread Analysis Software (Strength or Weakness Module)

Note:  To avoid confusion please note this was an older post which for some reason was not posted but rather saved as a draft.  As such the charts while relevant at the time are at different prices from current levels.


The proprietary SMART Volume Spread Analysis Software Strength or Weakness (AKA SOW not to be confused with Sign Of Weakness) Indication like many of the modules in SMART is just that… an indication… it shows whether there is strength or weakness in the background on a particular chart.  It has the additional benefit of determining whether supply or demand is present as well. 

A lot of the newer SMART Volume Spread Analysis Software users get into the habit of trying to trade every signal as if each is a tradeable event.  A number of the signals (detailed extensively in the live chat and here) are most definitely tradeable, and it’s not to say that the other patterns/signals aren’t important but that they should be treated as indications of strength and weakness and what is likely to happen rather than what will happen.


The SMART Strength or Weakness Module however has the distinction of being both an indication of strength or weakness and a tradeable signal.  Please read on.


We are only going to focus on the Strength and Demand indications within the SMART SOW module (Noted by blue and green square icons on the chart) as the reverse signals (Pink and red) do not react in the same manner. (Not enough to warrant discussion here anyway)


The signals within the SOW module come from proprietary code within our background scanners as well as supply and demand scanners within the module itself.  Normally on a single blue square (strength) I would say it’s just an indication and should not be traded solely because it has appeared.  The same goes for the green square (Demand) but when strength and demand indications occur on the same candle/bar it is quite different as the following examples will demonstrate.


I often say how easy SMART makes it to see/read what is really happening on the charts in real time and here is a perfect example. Take a look at the following charts and you should immediately be able to see the pattern we are discussing (Be aware of volume as well as these all occur within non dead zones (except one) You can see very easily how single blue squares react but more importantly how the price reacts when both supply and demand indications appear on the same candle/bar


Please keep in mind that these examples are not cherry picked, they are real World examples selected from all of the charts I watch where the signal(s) and or concepts being discussed have appeared at the time this article was written.


Example: SMART Volume Spread Analysis Software Globex H1 Aussie


SMART-Strength-or-Weakness-Example-Setup-01


Example: SMART Volume Spread Analysis Software Globex H1 British Pound


SMART-Strength-or-Weakness-Example-Setup-01.png


Example: SMART Volume Spread Analysis Software Globex H1 Euro


SMART-Strength-or-Weakness-Example-Setup-03


Example: SMART Volume Spread Analysis Software Globex H1 Japanese Yen


SMART-Strength-or-Weakness-Example-Setup-04


Please also keep in mind SMART Trader itself is painting these bars which makes these patterns and setups much easier to spot and act on.  There is no guesswork,  if a signal is painted it is valid.


These patterns repeat themselves day in and day out and using SMART you can clearly see not only standard VSA signals but our advanced multibar SMART VSA patterns as well.

Trade setups are verified using our proprietary background scanners (included with the system).
For more information or if you have any questions about SMART Trader Volume Spread Analysis (VSA) Software please visit
SMART Trader at pipbuilders.com or visit our Live and Free VSA (Volume Spread Analysis) Chat and Trading Room at http://vsa.pipbuilders.com


If you would like to receive real time Forex and ES Mini trade alerts sign up here


Good luck trading and see you in the chat.


PS Check out our friends at TradeTakers (A social network for Traders)
Posted in Main

22 Points On The ES Mini Using SMART Volume Spread Analysis Software

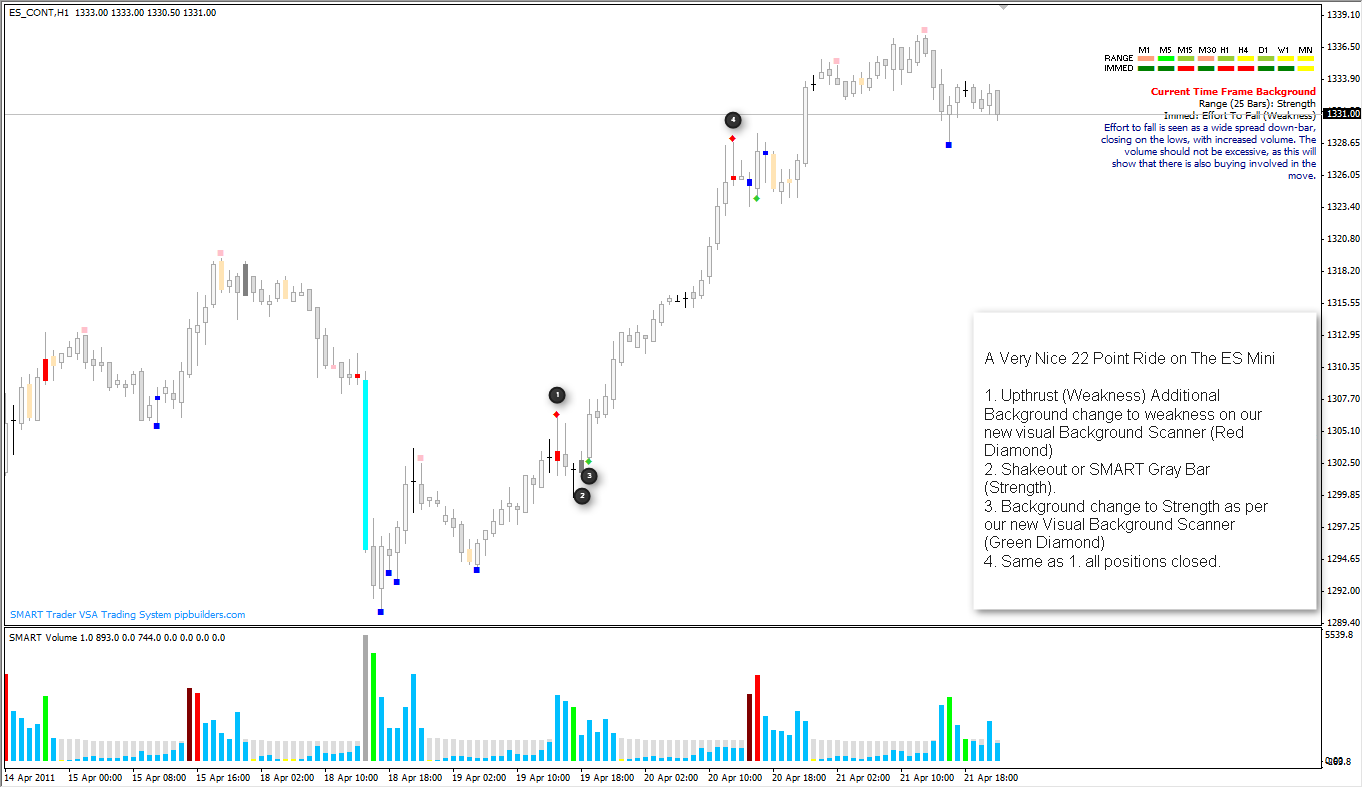
Here is an excellent example of SMART in action on the ES Mini.  Using some very simple tools within SMART Volume Spread Analysis Software you could have grabbed a nice 22 pip ride on the ES Mini using a Standard VSA pattern (Shakeout) and Our Proprietary Visual Background Scanners (Which are coming in a future update).


For those not in the chat and not aware of my calls/stats for the past week… Forex was +1824 pips, and ES was +1495 (Pip Equivalent), and my Daughters (Who I am training for the “SMART VSA, So easy an 8 year old can do it” project) are at 796 pips.


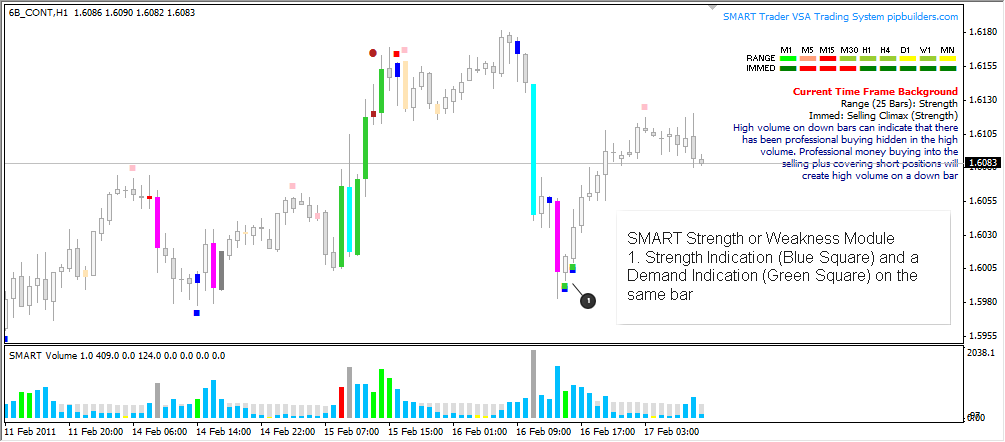
Please keep in mind that these examples are not cherry picked, the screenshots are real World examples selected from all of the charts I watch where the signal(s) and or concepts being discussed have appeared at the time this article was written.


22 Points On The ES Mini Using SMART Volume Spread Analysis Software - A Very Nice 22 Point Ride on The ES Mini


Text from screenshot:


A Very Nice 22 Point Ride on The ES Mini


1. Upthrust (Weakness) Additional Background change to weakness on our new visual Background Scanner (Red Diamond)
2. Shakeout or SMART Gray Bar (Strength).
3. Background change to Strength as per our new Visual Background Scanner (Green Diamond)
4. Back to an Upthrust (Weakness) Additional Background change to weakness on our new visual Background Scanner (Red Diamond) For a full 22ish point ride


Please also keep in mind SMART Trader itself is painting these bars which makes these patterns and setups much easier to spot and act on.  There is no guesswork,  if a signal is painted it is valid.
These patterns repeat themselves day in and day out and using SMART you can clearly see not only standard VSA signals but our advanced multibar SMART VSA patterns as well.
Trade setups are verified using our proprietary background scanners (included with the system).
For more information or if you have any questions about SMART Trader Volume Spread Analysis (VSA) Software please visit
SMART Trader at pipbuilders.com or visit our Live and Free VSA (Volume Spread Analysis) Chat and Trading Room at http://vsa.pipbuilders.com


If you would like to receive real time ES Mini trade alerts sign up here


Good luck trading and see you in the chat.


PS Check out our friends at TradeTakers (A social network for Traders)


Posted in Main