Blog Archives

Smart Volume Analysis 2.0 Officially Released!

As many of you know we have released Smart Volume Analysis 2.0 Unofficially Last Night (Message on your chart) – You may have noticed one major change… We changed the name of our product.  We did this because we wanted to distance ourselves somewhat from standard VSA.  It doesn't really work without massive tweaks and our proprietary concepts and many clients think the association is hurting us and we agree.  Smart Volume Analysis is way beyond the scope of the standard and less reliable Volume Spread Analysis so a name change was warranted.

The version number was also a big jump.  We changed to 2.0 (rather than 1.0.6) This is a huge update and reflects better where we are now in the development cycle.

SMART Volume Analysis v2.0 Release Notes:

Noteworthy Changes Since Last Update:
  • Changed Product Name From SMART Trader to SMART Volume Analysis
  • Optimized Upthrust and Reverse Upthrust Modules (Pseudo Versions As Well)
  • Optimized Absorption Volume Module
  • Optimized Range Background Scanner
  • Fixed Bug Within The SOW Module (Obsoleted As Well By The New Pattern Validation Module (Smart Visual Background Scanner)
  • Added Proprietary No Buying Interest Module And Custom Alert
  • Changed all indicators to default sounds off within the included templates
  • Optimized Global Settings
  • Fixed Issue With Gaps And Some Modules
  • Optimized And Added Additional Signal Condition To Banger Module
  • Added VBS to MTF Background GUI/MTF BG Scanner Modules.
  • Optimized Climactic Bar Conditions For EOM and Pattern Validation Module
  • Fixed Background Scanners Issue Related To Climactic Weak/Strong Bars.
  • Added Our Proprietary EOM (Expectation Of Movement) Concept Module
  • Optimized Conditional Settings For Smart Buying and Smart Selling Modules.

New Modules:
  • Unconfirmed No buying Interest Module
  • No Buying Interest Module (Confirming Signal)
  • Proprietary Smart Visual Background Scanner/Visual Background (VBS/VB)
  • Two Finger Salute (Advanced Module)
  • Fosters Flop (Advanced Module)
  • Proprietary Smart Zones Module
  • Proprietary EOM Concept Module

New files:
  • SMART Framework Module EOM
  • SMART Advanced Signal Module Fosters Flop
  • SMART Advanced Signal Module Two Finger Salute
  • SMART Signal Module Climactic Bar Strong
  • SMART Signal Module Climactic Bar Weak
  • SMART Signal Module No Buying Interest
  • SMART Signal Module UC No Buying Interest
  • SMART Visual Background
  • SMART Visual Background MTF
  • SMART VBS – iCustom
  • SMART VBS
  • SMART Zones – Debug (admin only)
  • SMART Zones – iCustom
  • SMART Zones MTF
  • SMART Zones
  • SMART Debug Range (admin only)
  • SMART Debug Volume (admin only)

We will be running the live room over the next few days (linked below) to help with any issues or questions you may have.  The lead developer will also be available to answer any technical questions.

For more information or if you have any questions about SMART Volume Spread Analysis (VSA) and our Software please visit the following link 
Smart Trader VSA (Volume Spread Analysis) Software you can also visit our Live and Free VSA (Volume Spread Analysis) Chat, Trading Rooms, and our other free volume spread analysis resource sites (linked below) to learn more.

For information on our real time, volume based trading alerts, Click here.

Good luck trading and see you in the chat (Links below).

Live Volume Spread Analysis (VSA) Trading Rooms, Chat, and Seminars:

Volume Spread Analysis (VSA) Social Networking Sites:
If you have any questions regarding Smart VSA or our software please visit our website (http://www.smartvsa.com) and submit a ticket using the support or contact link.

Thanks and see you in the chat.

Posted in Main

Smart Volume Analysis Trade Update (Combined 890 Pips): Trade Using Our Proprietary Visual Background Scanner and Smart Zone Levels For Signal Validation

Smart Volume Analysis Trade Update (Combined 890 Pips): Trade Using Our Proprietary Visual Background Scanner and Smart Zone Levels For Signal Validation


We have a flurry of new updates for the next release (Smart Volume Analysis Version 2.0).  I am going to be talking about two new framework modules in this article.  As many of you know from the live demos these new updates are very accurate and make Smart Volume Analysis Software even easier to use.  Two new modules for the next release we will be discussing here are our Proprietary Visual Background Scanner, and our new Proprietary Smart Zones Concept based in part on Supply Demand Zones. 

Many of you know my thoughts on standard VSA (many of you came to the same conclusions before finding Smart) and these new updates to our software bring our own Smart Volume Analysis to a whole new level and give our clients a renewed perspective on how to properly analyze volume.  We are now free of the contradictory nature of the “old way” and as a benefit, our volume analysis is far more accurate than any other volume analysis software.


When using these new tools in conjunction with Smart Volume Analysis Signals you can see from the following chart you were on the right side of each trade for the entire move down in EURUSD (890 Pips)


These examples are not cherry picked, the screenshots included in this article are real World examples selected from all of the charts I watch where the signal(s) and or concepts being discussed appeared at the time this article was written.


If you have any questions please refer to the links at the bottom of this article.


[screenshot]


Smart_volume_analysis_trading_


[text from screenshot]


Smart Volume Analysis Trade Update (Combined 890 Pips on EUR USD): Trade Using Our Proprietary Visual Background Scanner and Smart Zone Levels For Signal Validation


1. Proprietary Visual Background Scanner Weakness Indication (Hollow Red Circle)
2. First Weakness Signal – Smart Upthrust (Red) After VBS Change (Entry #1)
3. Reverse Upthrust (Blue) Strength and No Selling Pressure (Pale Yellow) Strength but Counter to VBS (No Trade)
4. Same as #3
5. Unconfirmed No Demand (Pink) Weakness and No Demand (Confirmed) (Entry #2 or simply hold initial)
6. Price Breaks Back Into Smart Zone (Red Line Upper Level) and falls straight through.
7. Exit when price hits the bottom of the Smart Zone (Blue Line Lower Level) (550+ Pips)
8. Proprietary Visual Background Scanner Weakness (Hollow Red Circle) Combined with Reverse Shakeout (Lite Gray) Entry #1
(We do have a Visual Background Scanner Strength Indication (Hollow Blue Circle) but no strength signal – no trade)
9. Close at Lower High Volume Zone (Green Areas) and Strength Indication (Proprietary Smart Buying)
10. New Proprietary Visual Background Scanner Weakness Indication (Hollow Red Circle) NO Weakness Signal No New Trade


Each VSA signal and indication within our software has it’s own color.  SMART Trader itself is painting these colors which makes these patterns and setups much easier to see and act on.  Using Smart VSA you can profit from these examples day in, and day out.  There is no guesswork.  If a signal is shown, it is valid.  It really is that simple.


Trade setups are verified using our proprietary visual background scanners and EOM concept module which are included with the system.


For more information or if you have any questions about SMART Volume Spread Analysis (VSA) and our Software please visit the following link
Smart Trader VSA (Volume Spread Analysis) Software you can also visit our Live and Free VSA (Volume Spread Analysis) Chat, Trading Rooms, and our other free volume spread analysis resource sites (linked below) to learn more.


For information on our real time, volume based trading alerts, Click here.


Good luck trading and see you in the chat (Links below).


Live Volume Spread Analysis (VSA) Trading Rooms, Chat, and Seminars:


Volume Spread Analysis (VSA) Social Networking Sites:
If you have any questions regarding Smart VSA or our software please visit our website (http://www.smartvsa.com) and submit a ticket using the support or contact link.


Thanks and see you in the chat.


Posted in Main

Smart Volume Spread Analysis on Multiple Charts and in Real Time (Video)

Join us for the future of Volume Spread Analysis.

Live Video Hangout is Online: http://goo.gl/Oo3Zt

We are demonstrating some of our newest test modules including Volume Based Support and Resistance HVZ, Smart Volume which does away with averaging and is far more accurate, Smart Buying, and Smart Selling etc.

If it's full keep on trying as people come and go all day.  Good luck trading and see you there.

Posted in Main

Invitation…

We have thousands of users spread out over multiple resource sites, blogs, social networking etc.  I am trying to consolidate our user base to a few sites to make it easier to update everyone on News, trade setups, etc.  Please join us (circle us) at Google+  where we can do chat, live video demonstrations and much more all in one location. To get started simply follow the links below.

A couple of new posts to the G+ Page as well as a Live Hangout on Mutliple Charts Demonstrating Smart and our new HVZ, Smart Volume, Smart Selling, and Smart Buying Test Modules are live now.

Google+: http://goo.gl/RIqHl (We just posted some new screen shots of the big moves overnight that smart got you in)
Hangout: http://goo.gl/5rVDX  (limited to 10 people at a time for now) Mute your video and audio before joining as we use the text chat and screen sharing feature.

Thanks
and see you there.
Posted in Main

Easy Trade: EUR USD 140+ Pip Move Using Smart VSA (Volume Spread Analysis) Software

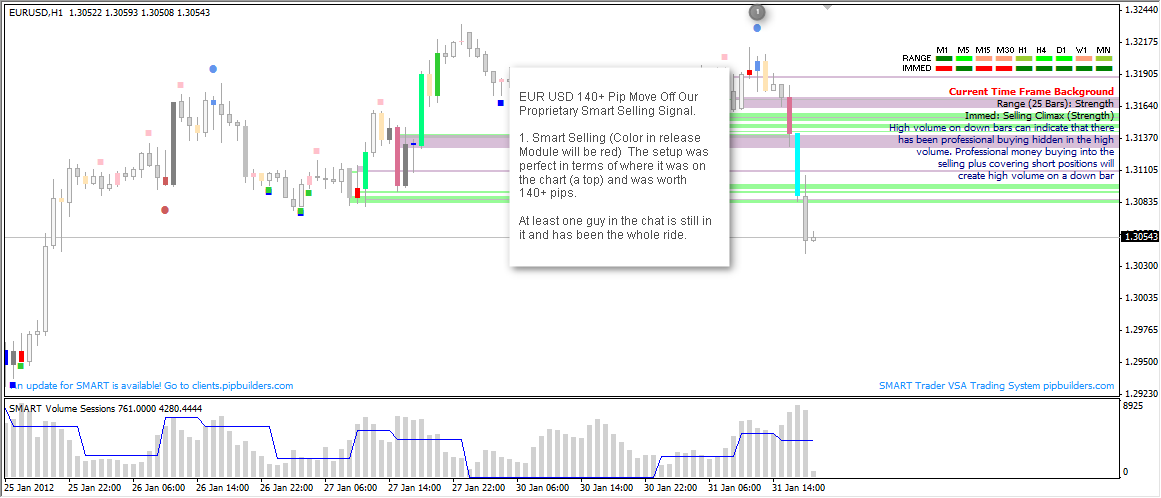
Here is a quick post to highlight a 140 pip move on EURUSD from earlier using one of our Proprietary (and my personal favorite) signals Smart Selling #1 on the chart.


[Text from screenshot]
EUR USD 140+ Pip Move Off Our Proprietary Smart Selling Signal. 

1. Smart Selling (Color in release Module will be red) The setup was perfect in terms of where it was on the chart (a top) and was worth 140+ pips.


[Screenshot]


There are some test modules on the chart (HVZ and Smart Volume) as we are demonstrating them live in the G+ video chat (link is below)


eurusd-140-pip-move-using-Smart-Volume-Spread-Analysis-Smart-Selling


These examples are not cherry picked, the screenshots are real World examples selected from all of the charts I watch where the signal(s) and or concepts being discussed have appeared at the time this article was written. 

Please also keep in mind SMART Trader itself is painting these bars which makes these patterns and setups much easier to spot and act on. There is no guesswork, if a signal is painted it is valid. 

These patterns repeat themselves day in and day out and using SMART you can clearly see not only standard VSA signals but our advanced multibar SMART VSA patterns as well.
Trade setups are verified using our proprietary background scanners which are included with the system. 

For more information or if you have any questions about SMART Volume Spread Analysis (VSA) Software please visit the following links: 

Smart Volume Spread Analysis Blog: http://pipbuilders.posterous.com
Smart Trader VSA (Volume Spread Analysis) Software: http://www.smartvsa.com
You can also visit our Live and Free VSA (Volume Spread Analysis) Chat and Trading Room athttp://vsa.pipbuilders.com during normal market hours. 

We also do live video hangouts at Google+ here: http://goo.gl/nzRa0 

If you would like to receive information on our real time trade alert service for EMini and Forex etc. visit: http://www.traderelayer.com 

Good luck trading and see you in the chat.

Posted in Main

How To: Trading High Volume Zones (Volume Based Support Support and Resistance) within Smart Volume Analysis Software

High Volume Zones (HVZ) are areas where volume is at it’s highest for a given period and the zone (price levels) it occurred on the long side and the short side. It is very simply what we refer to as Smart Volume Based Support and Resistance (VSR). They tend to be far more accurate than simple S/R due to the additional component of volume.
The screenshot shows our HVZ module (and Smart Volume) that we demonstrated live and in real time within our Google+ Hangout earlier today.

I will note a few things here rather than the chart itself as there is a lot going on.

High+Volume+Zone+Trading+Using+Smart+Volume+Spread+Analysis[1]
1. Shows the various HVZ areas drawn automatically by our software.

2. Is where we started our analysis live and the Climax Sell (Painted automatically by Smart) which broke through the preceding HVZ and gave us a new low and high HVZ to trade within. Each bounce and signal within was good for about 4 points. By trading within you end up with many more points than simply holding for a big move.

3. Is a good example of a strong signal breaking through a HVZ which is needed to breakout of an HVZ range. In this example it is a High Volume Effort To Fall (Painted automatically by Smart)

4. Is our Smart Buying Signal (Proprietary) that gave an easy 4.25 points off the HVZ

5. A Shakeout (Painted automatically by Smart) which normally in an excellent long entry point wasn’t able to break through so we would expect a move back down.

The following bars were traded back and forth quite easily using the HVZ areas as S/R lines.

Some additional notes about our HVZ module: HVZ are zones not exact levels, they are very strong areas of support and resistance.

These examples are not cherry picked, the screenshots are real World examples selected from all of the charts I watch where the signal(s) and or concepts being discussed have appeared at the time this article was written.

Please also keep in mind SMART Trader itself is painting these bars which makes these patterns and setups much easier to spot and act on. There is no guesswork, if a signal is painted it is valid.

These patterns repeat themselves day in and day out and using SMART you can clearly see not only standard VSA signals but our advanced multibar SMART VSA patterns as well.
Trade setups are verified using our proprietary background scanners and Smart Advisor which are included with the system.

For more information or if you have any questions about SMART Volume Spread Analysis (VSA) Software please visit the following links:

Smart Trader VSA (Volume Spread Analysis) Software you can also visit our Live and Free VSA (Volume Spread Analysis) Chat, Trading Rooms, and our other free volume spread analysis resource sites (linked below) to learn more.

For information on our real time, volume based trading alerts, Click here.
Usergroups:

Miscellaneous Resources:

Contact and Support Links:


Please note: This is an older article posted to our resource site.  It got lost in the move so I am reposting it here but as it’s older some things may have changed.  We do many free updates and sometimes things change, if you have any questions or notice an outdated reference please contact us from the support link on the website.

Posted in Main

Codename: Chaplin (A new Smart Volume Spread Analysis Signal) An easy 130+ Pips on one chart alone.

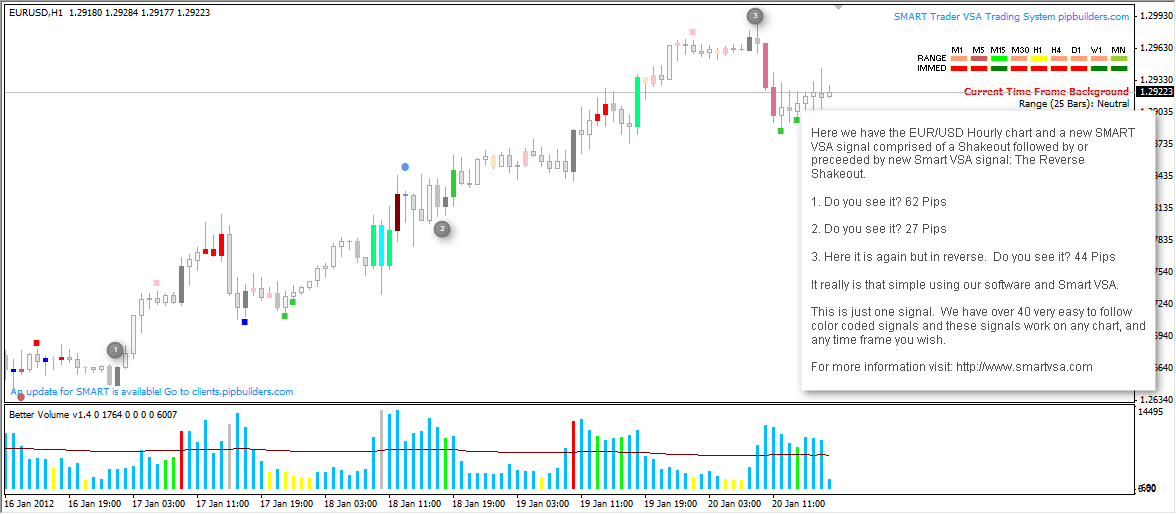
Here is a EUR USD chart showing a potential Smart VSA (Volume Spread Analysis) signal we are testing. Code named: Chaplin 

You don’t need to wait for the module… If you own Smart take a look at some of your charts for this pattern and let us know what you think. Please keep in mind that I trade off the hourly so mileage may vary on other time frames. 

Text from the screenshot:

Here we have the EUR/USD Hourly chart and a new SMART VSA signal comprised of a Shakeout followed by or preceeded by new Smart VSA signal: The Reverse Shakeout. The moves off this one Smart VSA signal was a combined 133 Pips on the EUR USD Alone. 

1. Do you see it? 62 Pips 

2. Do you see it? 27 Pips 

3. Here it is again but in reverse. Do you see it? 44 Pips 

Smart VSA Test Module Signal Chaplin.png


It really is that simple using our software and Smart VSA. 

This is just one signal. We have nearly 40 very easy to follow color coded signals included with our software and these signals work on any chart, and any time frame you wish. 

These examples are not cherry picked, the screenshots are real World trades selected from all of the charts I watch where the signal(s) and or concepts being discussed have appeared at the time this post was written. 

Keep in mind SMART Trader itself colors each valid Volume Spread Analysis and Smart Volume Spread Analysis bar which makes these patterns and setups much easier to spot and act on. There is no guesswork, if a signal is painted it is valid. 

These patterns repeat themselves day in and day out and using SMART you can clearly see not only standard VSA signals but our advanced multibar SMART VSA patterns as well.
Trade setups are verified using our proprietary background scanners which are included with the system. 

For more information or if you have any questions about SMART Volume Spread Analysis (VSA) Software please visit the following link:http://goo.gl/V1171  

You can also visit our Live and Free VSA (Volume Spread Analysis) Chat and Trading Room at http://vsa.pipbuilders.com during normal market hours. 

Visit us on Google+ for expanded information, setups, live demonstrations, etc. Click here :http://goo.gl/nzRa0

Posted in Main

Easy 88 Pips on EUR USD Using Smart Volume Spread Analysis Software

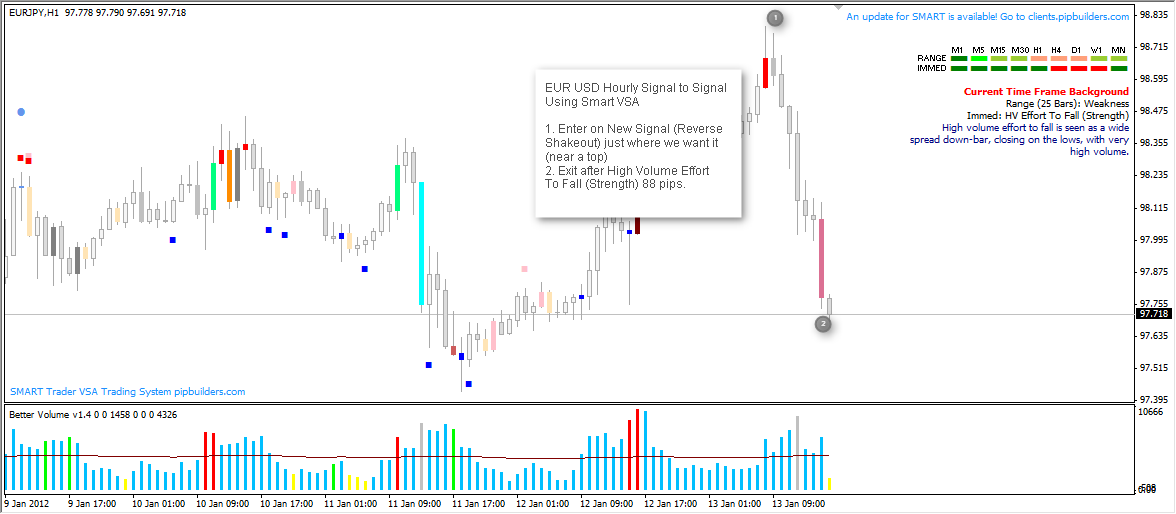
Here is a nice example of one of the newer Smart VSA (Volume Spread Analysis) signals in action on the EUR USD Hourly Chart that was a good for 88 pips. 

These examples are not cherry picked, the screenshots are real World trades and examples selected from all of the charts I watch where the signal(s) and or concepts being discussed have appeared at the time this article was written. 

Screenshot:

Eur-Usd-Reverse-Shakeout-High-Volume-Effort-To-Fall


Text from the screenshot: 

EUR USD Hourly. Signal to Signal Trading Using Smart Volume Spread Analysis 

1. Enter Short on New Signal (Reverse Shakeout) just where we want it (near a top with weakness)
2. Exit after High Volume Effort To Fall (Strength) 88 pips. 

SMART Trader is painting these bars which makes these patterns and setups much easier to spot and act on.  There is no guesswork,  if a signal is painted it is valid. 

These patterns repeat themselves day in and day out and using SMART you can clearly see not only standard VSA signals but our advanced multibar SMART VSA patterns as well. 

Trade setups are verified using our proprietary background scanners which is included with the system. 

For more information or if you have any questions about SMART Volume Spread Analysis (VSA) Software please visit the following link
Smart Trader VSA (Volume Spread Analysis) Software you can also visit our Live and Free VSA (Volume Spread Analysis) Chat and Trading Room at http://vsa.pipbuilders.com during normal market hours. 

If you would like to enroll in our real time trade alert service for EMini and Forex etc. sign up here 

Good luck trading and see you in the chat. 

You can also reach us on… 


Posted in Main

“Superfeeds” in The New Version of Smart VSA (Volume Spread Analysis) Software

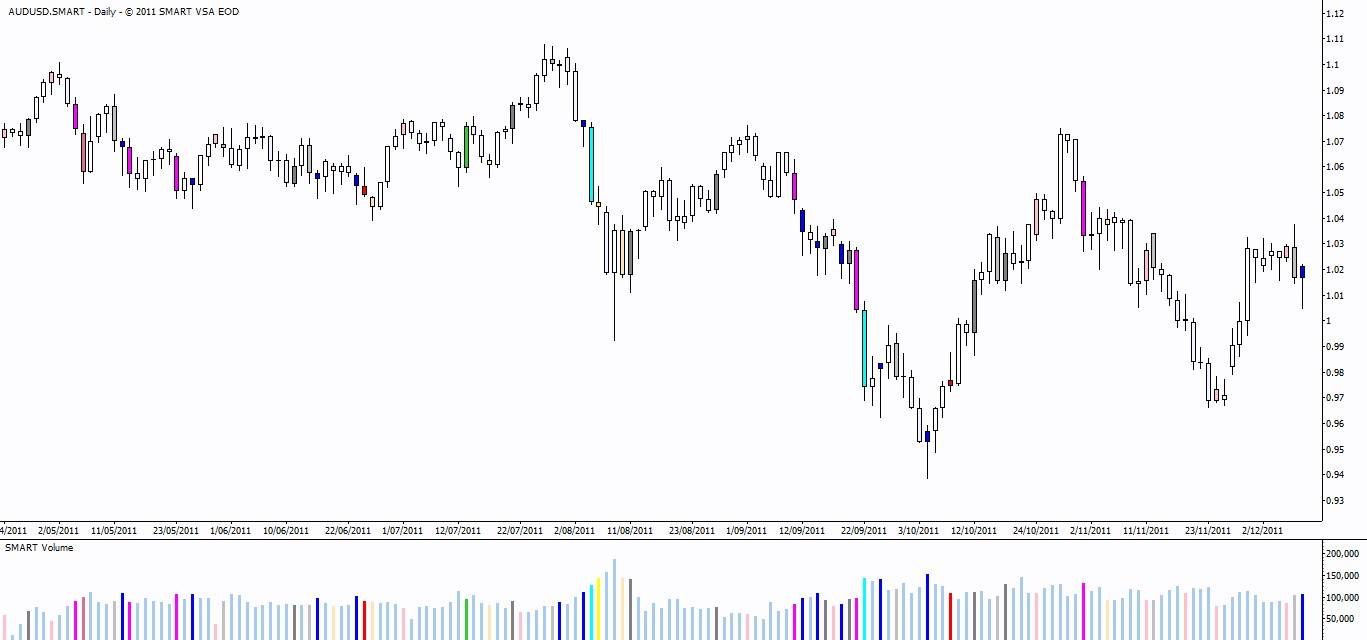
A screenshot showing one new proprietary feature/concept (Superfeeds) in the upcoming Stand Alone version: 

AUDUSD.SMART


To the untrained eye it doesn’t look much different but I assure you… it is. 🙂  This test combines 7 data sources into one 

If you do not currently own Smart you are running out of time to get the Stand Alone when it’s released for free.  All owners of the current version will get a free upgrade…. but only for a limited time (Jan 1st 2012 will likely be the cutoff date)


For more information or if you have any questions about SMART Volume Spread Analysis (VSA) Software please visit the following link
Smart Trader VSA (Volume Spread Analysis) Software you can also visit our Live and Free VSA (Volume Spread Analysis) Chat and Trading Room at http://vsa.pipbuilders.com during normal market hours.


If you would like to receive information on our real time trade alert service for EMini and Forex etc. sign up here


Good luck trading and see you in the chat.


You can also reach us on…
  • Facebook: 

http://www.facebook.com/groups/smarttraders/

  • Google Plus: 


https://plus.google.com/114020025179123144680/posts


Posted in Main

Issues With The Free Volume Spread Analysis Chat Server (Fix)

As you may or may not know the chat server moved to a new domain this last week and the old domain no longer works.  This cause problems for a lot of our users and most of you were locked out.

If you are using an IRC client to enter the chat please change the server name to "irc.ircforex.co" (yes ".co" that is NOT a typo)

The redirect has been fixed for the web based users as well.  The address for the web based chat client is the same as always (http://vsa.pipbuilders.com)

We recommend using a full IRC client so that you can stay logged in and not miss anything if your connection/web browser is closed.

For a step by step guide on how to enter using an IRC client please visit here:  http://www.pipbuilders.com/pidgin/  The text parts have been corrected for the new information but not the screenshots so pay attention to the server name field and remember it's .co not .com

Thanks and see you in the chat.
Posted in Main