Five Days, No Losses. (400+ pips) Using Our Simple 4 Step Method – A Former TradeGuider User Talks About Smart

We had a nice testimonial in the live room today too. A new user of Smart said this.

“Ganesh (2:12 PM): Dude, I have been using Trade Guider for over a year and Smart beats it right left and center….

He added…. “well I am not just saying it for the sake off, damn thing works though so far! i now relax without looking at it quiet often
so far with my demo its 400+ pips”

5 days, no losses 400+ pips using our simple 4 step method. ( The 4 step method article is here: http://goo.gl/1L1hV)

Do us a favor though… Tell your friends because we already know its awesome.

The full chat log is posted on our usergroup and many more testimonials are available upon request.

For more information or if you have any questions about SMART Volume Spread Analysis (VSA) and our Software please visit the following link

Smart Trader VSA (Volume Spread Analysis) Software you can also visit our Live and Free VSA (Volume Spread Analysis) Chat, Trading Rooms, and our other free volume spread analysis resource sites (linked below) to learn more.
For information on our real time, volume based trading alerts, Click here.
Good luck trading and see you in the chat (Links below).
Live Volume Spread Analysis (VSA) Trading Rooms, Chat, and Seminars:
Volume Spread Analysis (VSA) Social Networking Sites:
If you have any questions regarding Smart VSA or our software please visit our website (http://www.smartvsa.com) and submit a ticket using the support or contact link.
Thanks and see you in the chat.
Posted in Main

Smart Volume Analysis Smart Buying Module on AUDNZD (400+ Pips Available)

Forgive the lack of posts here lately but as you may or may not know we’ve moved our discussions and posting to our Official Google Plus Community site and usergroups (linked below and above).  Please join us there so you don’t miss any information/setups.
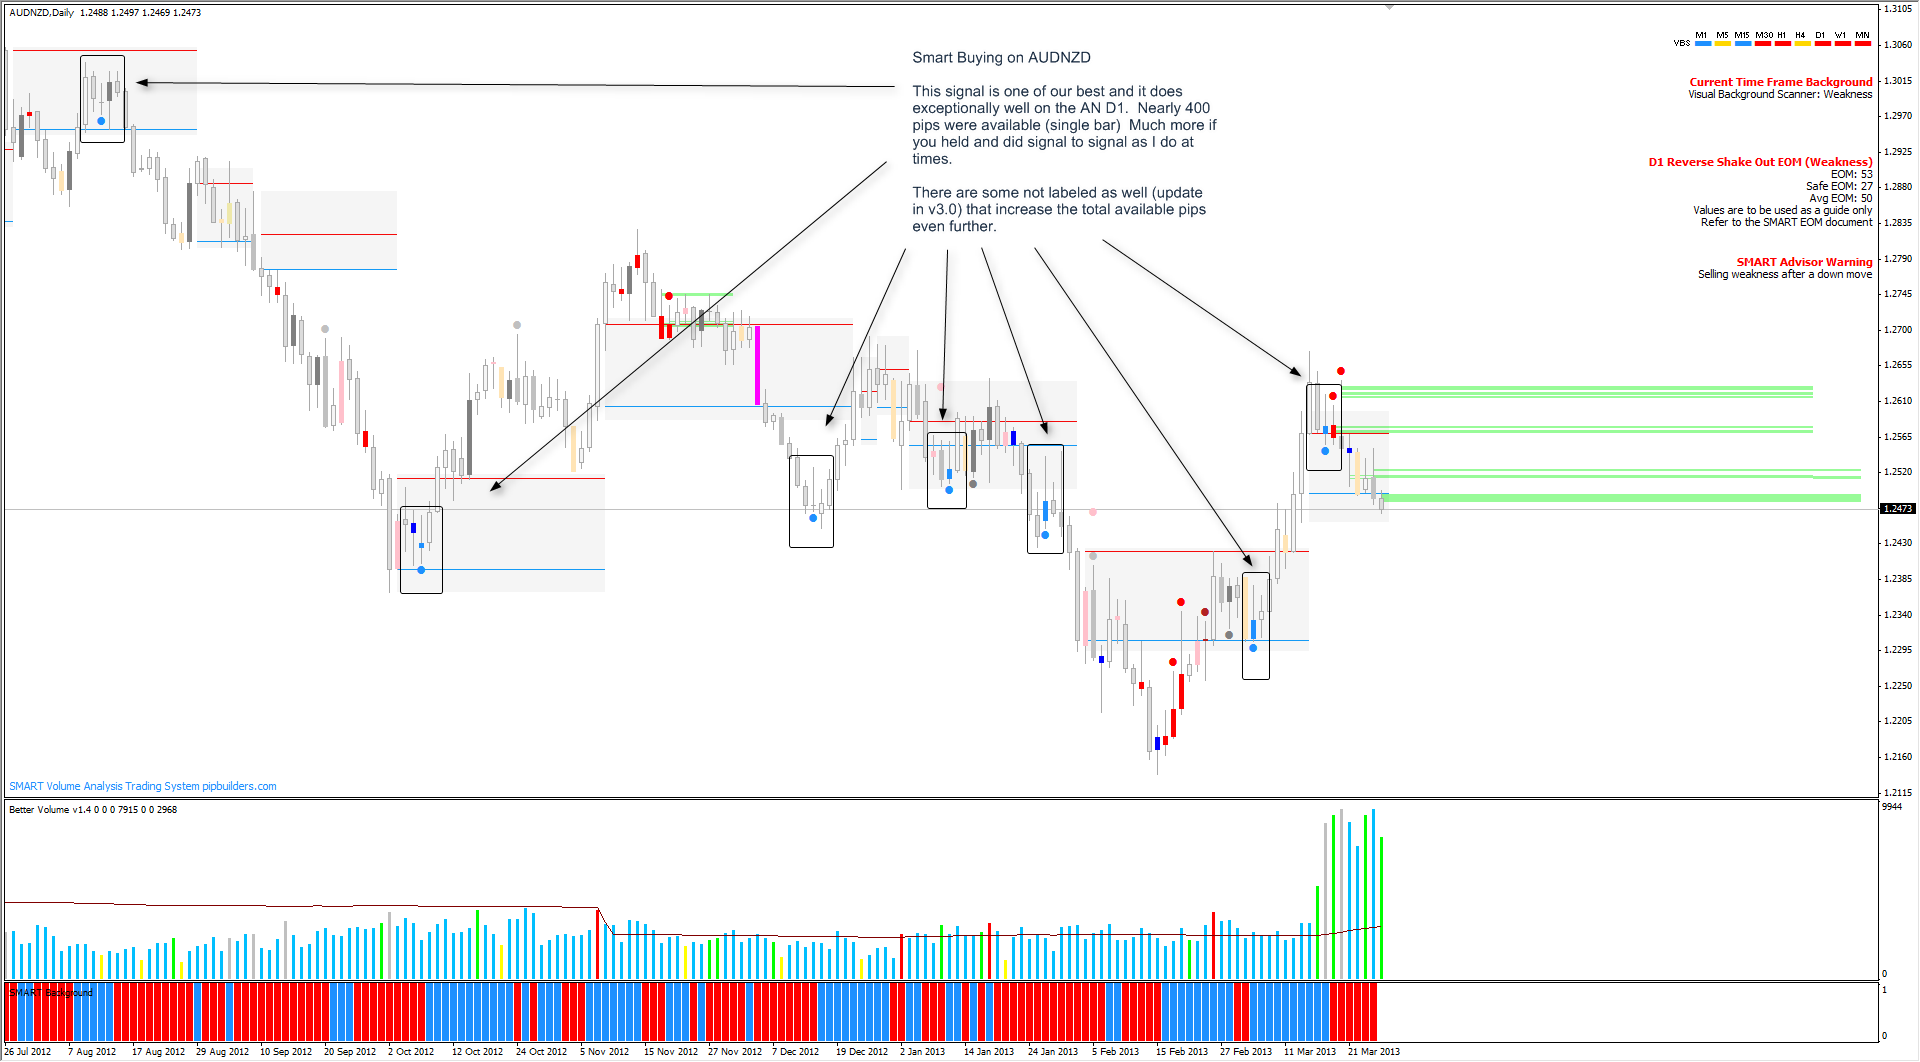
Smart Buying is a just one proprietary signal of ours included within our Smart Volume Spread Analysis Software.  It works exceptionally well on it’s own but with a little chart time (This took me literally two seconds to spot in the free live room) you’ll find it does even better on certain certain chart time frames as shown here using recent examples of D1 AUDNZD.  A combined total of 400+pips were available very easily using this one signal alone on this chart.
There are some new updates coming in v3.0 as well that will make this module (and many others) even easier to take advantage of.
Note: These examples are not cherry picked, the screenshots included in this article are real World examples selected from all of the charts I watch where the signal(s) and or concepts being discussed appeared at the time this article was written.
If you have any questions please refer to the links at the bottom of this article.
Smart Buying AUDNZD Daily - 400 pips

Smart Buying AUDNZD Daily – 400 pips

Each VSA signal and indication within our software has it’s own color.  SMART Trader itself is painting these colors which makes these patterns and setups much easier to see and act on.  Using Smart VSA you can profit from these examples day in, and day out.  There is no guesswork.  If a signal is shown, it is valid.  It really is that simple.

Trade setups are verified using our Proprietary Smart Visual Background Scanner Module and Proprietary Smart EOM Concept Module which are included with the system.

For more information or if you have any questions about SMART Volume Spread Analysis (VSA) and our Software please visit the following link

Smart Trader VSA (Volume Spread Analysis) Software you can also visit our Live and Free VSA (Volume Spread Analysis) Chat, Trading Rooms, and our other free volume spread analysis resource sites (linked below) to learn more.
For information on our real time, volume based trading alerts, Click here.
Good luck trading and see you in the chat (Links below).

Live Volume Spread Analysis (VSA) Trading Rooms, Chat, and Seminars:
Volume Spread Analysis (VSA) Social Networking Sites:
If you have any questions regarding Smart VSA or our software please visit our website (http://www.smartvsa.com) and submit a ticket using the support or contact link or join us on any of our official (Free) usergroups.
Thanks and see you in the chat.
Posted in Main Tagged with: ,

Live Smart Volume Analysis Room Is Open

Our free live trading room is open: http://live.smartvsa.com/

We will be discussing Smart Volume Spread Analysis and Trade Setups on Live charts using Smart VSA (for more information on Smart Volume Spread Analysis and how effective it is visit: http://goo.gl/eY0Es)

If you get an error saying the meeting is closed or the code is invalid, it simply means the meeting is done for the day.

Posted in Main Tagged with: , ,

Smart Volume Spread Analysis and The United States Election (48 points on the ES/Emini)

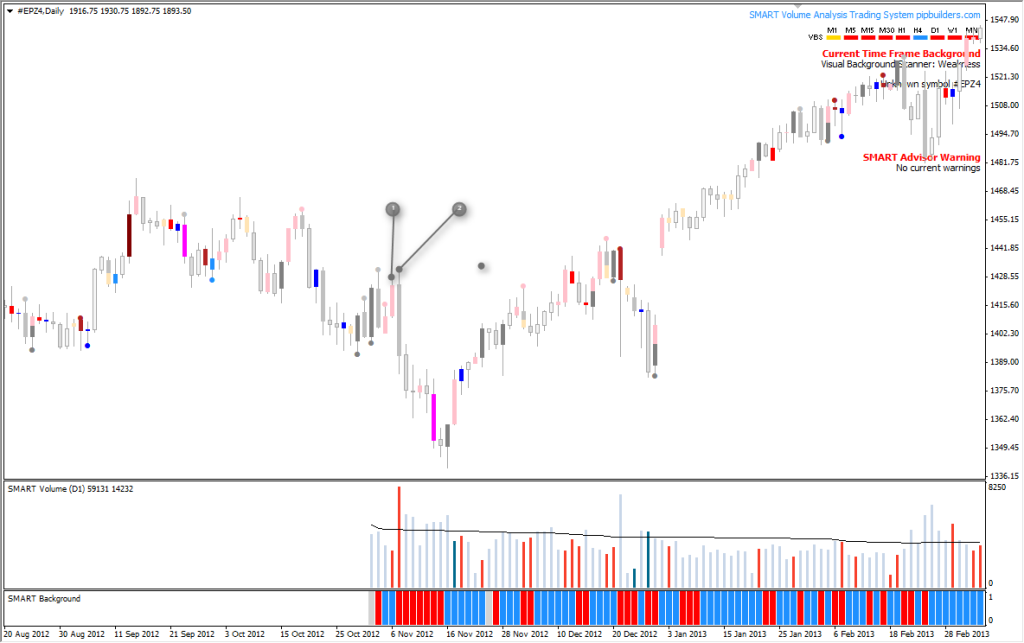
Someone asked via PM at our Free User Group (Linked above) to show how smart did pre and post election on the Daily ES Chart. Here’s the screenshot. #1 was a Smart No Demand (The day of the election which means weakness should follow), which then confirmed on #2 as a Reverse Shakeout and a very nice move down of the Smart No Demand entry (It was also a Banger Signal.) Weakness was called by Smart with powerful weakness signals on both days and you can clearly see how it did. There were many moves #2 to take some of the moves back and forth within that daily candle. This move was worth roughly 48 points (48*50 = Pip Equivalent at $ per pip). Trust Smart. That is all.

Here is the screenshot:

Smart Volume Spread Analysis and The United States Election (48 points on the ES/Emini)

Smart Volume Spread Analysis and The United States Election (48 points on the ES/Emini)


These examples are not cherry picked, the screenshots included in this article are real World examples selected from all of the charts I watch where the signal(s) and or concepts being discussed appeared at the time this article was written.
If you have any questions please refer to the links at the bottom of this article.
Each VSA signal and indication within our software has it’s own color.  SMART Trader itself is painting these colors which makes these patterns and setups much easier to see and act on.  Using Smart VSA you can profit from these examples day in, and day out.  There is no guesswork.  If a signal is shown, it is valid.  It really is that simple.
Trade setups are verified using our Proprietary Smart Visual Background Scanner Module and Proprietary Smart EOM Concept Module which are included with the system.
For more information or if you have any questions about SMART Volume Spread Analysis (VSA) and our Software please visit the following link
Smart Trader VSA (Volume Spread Analysis) Software you can also visit our Live and Free VSA (Volume Spread Analysis) Chat, Trading Rooms, and our other free volume spread analysis resource sites (linked below) to learn more.
For information on our real time, volume based trading alerts, Click here.
Good luck trading and see you in the chat (Links below).
Live Volume Spread Analysis (VSA) Trading Rooms, Chat, and Seminars:
Volume Spread Analysis (VSA) Social Networking Sites:
If you have any questions regarding Smart VSA or our software please visit our website (http://www.smartvsa.com) and submit a ticket using the support or contact link.
Thanks and see you in the chat.
Posted in Main

Smart Volume Spread Analysis and 750+ Reasons Why You Shouldn’t Have Been Shorting The Euro

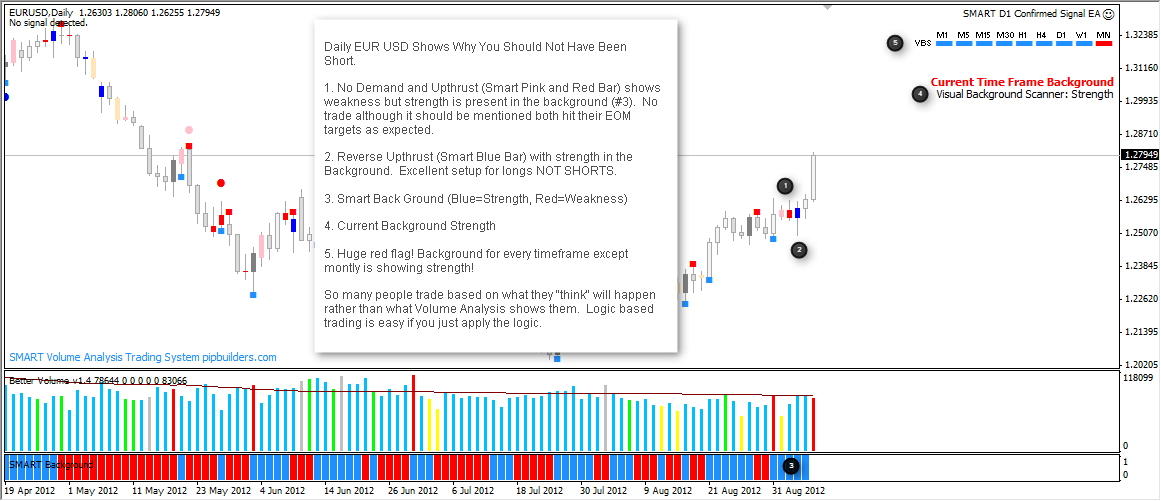
As a follow up to my last post regarding the EURUSD… Here Are Five Reasons (AKA 750+ Reasons) Why You Shouldn’t Have Been Shorting The Euro:

Update 09/14/2012: We’re now up an additional +270 pips from the last Smart Shakeout (Strength #5) on the screenshot,  and +1000 combined pips since the initial long indication (#1).  I am now looking for signs of weakness in the coming days. These examples are not cherry picked, the screenshots included in this article are real World examples selected from all of the charts I watch where the signal(s) and or concepts being discussed appeared at the time this article was written.

If you have any questions please refer to the links at the bottom of this article.

Each VSA signal and indication within our software has it’s own color.  SMART Trader itself is painting these colors which makes these patterns and setups much easier to see and act on.  Using Smart VSA you can profit from these examples day in, and day out.  There is no guesswork.  If a signal is shown, it is valid.  It really is that simple.

Trade setups are verified using our Proprietary Smart Visual Background Scanner Module and Proprietary Smart EOM Concept Module which are included with the system.

For more information or if you have any questions about SMART Volume Spread Analysis (VSA) and our Software please visit the following link

Smart Trader VSA (Volume Spread Analysis) Software you can also visit our Live and Free VSA (Volume Spread Analysis) Chat, Trading Rooms, and our other free volume spread analysis resource sites (linked below) to learn more.
For information on our real time, volume based trading alerts, Click here.
Good luck trading and see you in the chat (Links below).
Live Volume Spread Analysis (VSA) Trading Rooms, Chat, and Seminars:
Volume Spread Analysis (VSA) Social Networking Sites:
If you have any questions regarding Smart VSA or our software please visit our website (http://www.smartvsa.com) and submit a ticket using the support or contact link.
Thanks and see you in the chat.
Posted in Main

Volume Spread Analysis Using SMART Trader – Smart Trading using Smart Volume Analysis (VSA) Got You In For The Huge Move Up In The Euro (Over a week Before It Began).

Smart Trading using Smart Volume Analysis (VSA) Got You In For The Huge Move Up In The Euro (Over a week ago).


As many of you know I have been busy dealing with some personal issues recently (My Daughter has been in the hospital) which is why the groups and chats have been very slow but I wanted to address some recent comments in a lot of the trading groups I frequent and even a few comments privately from members within our own Smart Traders group (Our Group is free and it is private…  The link is below).


I saw a number of people complaining that they caught with their pants down on the recent EU rally (even some of our own users)…  They “thought” the EU would fall rather than simply following what Smart Volume Analysis was showing and go long, they went short and kept doing so even with all signs pointing to strength NOT weakness.


Take a look at the following chart.  You can clearly see why it’s better to let the chart show you what’s happening rather than trading off what you think will happen. Remember…  The market doesn’t care what you “think” and it will remind you of that over and over unless you start using Smart Volume Analysis.


Keep in mind these examples are not cherry picked, the screenshots included in this article are real World examples selected from all of the charts I watch where the signal(s) and or concepts being discussed appeared at the time this article was written.


If you have any questions please refer to the links at the bottom of this article.


[screenshot]


Euro_rally_entry_more_than_a_w


Each VSA signal and indication within our software has it’s own color.  SMART Trader itself is painting these colors which makes these patterns and setups much easier to see and act on.  Using Smart VSA you can profit from these examples day in, and day out.  There is no guesswork.  If a signal is shown, it is valid.  It really is that simple.


Trade setups are verified using our Proprietary Smart Visual Background Scanner Module andProprietary Smart EOM Concept Module which are included with the system.


For more information or if you have any questions about SMART Volume Spread Analysis (VSA) and our Software please visit the following link
Smart Trader VSA (Volume Spread Analysis) Software you can also visit our Live and Free VSA (Volume Spread Analysis) Chat, Trading Rooms, and our other free volume spread analysis resource sites (linked below) to learn more.


For information on our real time, volume based trading alerts, Click here.


Good luck trading and see you in the chat (Links below).


Live Volume Spread Analysis (VSA) Trading Rooms, Chat, and Seminars:


Volume Spread Analysis (VSA) Social Networking Sites:
If you have any questions regarding Smart VSA or our software please visit our website (http://www.smartvsa.com) and submit a ticket using the support or contact link.


Thanks and see you in the chat.
Posted in Main

Everything You Need To Know To Trade Smart Successfully in 4 Steps…

As many of you know from the live trading and chat rooms I can be a bit of a goofball but the post title of this article above is no joke…

Unlike our competition (if you can even call them that) we do not need to charge you for mentoring, seminars, boot camps, books, useless add on’s, or any other nonsense.  We sell a full suite of Proprietary Volume Analysis Modules in one simple package and you’ll never have to pay for upgrades, lease for multiple payments, or pay for new signal modules, concept modules, or updates.
Our goal is to help you make money not for you to help us make money.  We will not scam or spam you into buying software that does not work only to charge you more money to “learn” it.  As complex as our software is behind the scenes, we can show you how to trade it successfully in 4 simple steps using very simple rules/guidelines. Profit targets, which are based on our proprietary EOM concept combined with the Stronger Signals, our Smart Advisor, and Smart Background Modules (VBS) are hit as high as 80-90%+ on most stronger signals when using this method correctly.
For those looking for more robust information and methods, this is but one way to use our software, there are many more and we detail them for free in our live video room daily.

While our software and the concepts that make it work so well are extremely complex,  the rules for trading the software are not.  Look at the screenshot below to see one very easy (and profitable) method to trade Smart.

Don’t just take our word for it.  Come into any of our FREE resource sites and see what real users are saying.  Now onto the examples and screenshot.


These examples are not cherry picked, the screenshots included in this article are real World examples selected from all of the charts I watch where the signal(s) and or concepts being discussed appeared at the time this article was written.


If you have any questions please refer to the links at the bottom of this article.


[screenshot]


Smart-Rules-For-New-Users-(and-Old)-Screenshot-01


[text from screenshot]


Everything You Need To Know To Trade Smart Successfully in 4 Steps…


1. Check if last bar was a signal


2. If it was a signal, look to the right of your chart to see it’s name and meaning.


3. Look at the top right VBS GUI (Smart Background) if current time frame (and H4 if on H1) match direction of the last signal (last bar only) (Strength is Blue and Weakness is Red) If it does match, open a trade in that direction. 


4.Target the safe EOM. If it hits the safe EOM take it out. If candle closes and it didn’t hit, take it out.  On longer timeframes and stronger signals you can set a trail at the safe EOM and try for the max


5. This is the daily chart so only the D1 VBS is needed (You can also use the Smart Background (3.) Below which is the same as VBS just represented differently)


Addendum to 4. EOM’s are very powerful target levels based on a proprietary concept of ours.  Even signals that appear to have failed hit the safe EOM during the trade bar with stunning accuracy.  Also when the Smart Advisor module (added after this article was posted) is used the results are even better.


It really is this simple.  For those looking for more robust information this is but one way to use our software, there are more and we detail them all for free in our live video room daily.


Each VSA signal and indication within our software has it’s own color.  SMART Trader itself is painting these colors which makes these patterns and setups much easier to see and act on.  Using Smart VSA you can profit from these examples day in, and day out.  There is no guesswork.  If a signal is shown, it is valid.  It really is that simple.


Trade setups are verified using our Proprietary Smart Visual Background Modules and Proprietary Smart EOM Concept Module which are included with the system.


For more information or if you have any questions about SMART Volume Spread Analysis (VSA) and our Software please visit the following link
Smart Trader VSA (Volume Spread Analysis) Software you can also visit our Live and Free VSA (Volume Spread Analysis) Chat, Trading Rooms, and our other free volume spread analysis resource sites (linked below) to learn more.


For information on our real time, volume based trading alerts, Click here.


Good luck trading and see you in the chat (Links below).


Live Volume Spread Analysis (VSA) Trading Rooms, Chat, and Seminars:


Volume Spread Analysis (VSA) Social Networking Sites:
If you have any questions regarding Smart VSA or our software please visit our website (http://www.smartvsa.com) and submit a ticket using the support or contact link.


Thanks and see you in the chat.


Posted in Main

Smart Volume Analysis 2.0 Officially Released!

As many of you know we have released Smart Volume Analysis 2.0 Unofficially Last Night (Message on your chart) – You may have noticed one major change… We changed the name of our product.  We did this because we wanted to distance ourselves somewhat from standard VSA.  It doesn't really work without massive tweaks and our proprietary concepts and many clients think the association is hurting us and we agree.  Smart Volume Analysis is way beyond the scope of the standard and less reliable Volume Spread Analysis so a name change was warranted.

The version number was also a big jump.  We changed to 2.0 (rather than 1.0.6) This is a huge update and reflects better where we are now in the development cycle.

SMART Volume Analysis v2.0 Release Notes:

Noteworthy Changes Since Last Update:
  • Changed Product Name From SMART Trader to SMART Volume Analysis
  • Optimized Upthrust and Reverse Upthrust Modules (Pseudo Versions As Well)
  • Optimized Absorption Volume Module
  • Optimized Range Background Scanner
  • Fixed Bug Within The SOW Module (Obsoleted As Well By The New Pattern Validation Module (Smart Visual Background Scanner)
  • Added Proprietary No Buying Interest Module And Custom Alert
  • Changed all indicators to default sounds off within the included templates
  • Optimized Global Settings
  • Fixed Issue With Gaps And Some Modules
  • Optimized And Added Additional Signal Condition To Banger Module
  • Added VBS to MTF Background GUI/MTF BG Scanner Modules.
  • Optimized Climactic Bar Conditions For EOM and Pattern Validation Module
  • Fixed Background Scanners Issue Related To Climactic Weak/Strong Bars.
  • Added Our Proprietary EOM (Expectation Of Movement) Concept Module
  • Optimized Conditional Settings For Smart Buying and Smart Selling Modules.

New Modules:
  • Unconfirmed No buying Interest Module
  • No Buying Interest Module (Confirming Signal)
  • Proprietary Smart Visual Background Scanner/Visual Background (VBS/VB)
  • Two Finger Salute (Advanced Module)
  • Fosters Flop (Advanced Module)
  • Proprietary Smart Zones Module
  • Proprietary EOM Concept Module

New files:
  • SMART Framework Module EOM
  • SMART Advanced Signal Module Fosters Flop
  • SMART Advanced Signal Module Two Finger Salute
  • SMART Signal Module Climactic Bar Strong
  • SMART Signal Module Climactic Bar Weak
  • SMART Signal Module No Buying Interest
  • SMART Signal Module UC No Buying Interest
  • SMART Visual Background
  • SMART Visual Background MTF
  • SMART VBS – iCustom
  • SMART VBS
  • SMART Zones – Debug (admin only)
  • SMART Zones – iCustom
  • SMART Zones MTF
  • SMART Zones
  • SMART Debug Range (admin only)
  • SMART Debug Volume (admin only)

We will be running the live room over the next few days (linked below) to help with any issues or questions you may have.  The lead developer will also be available to answer any technical questions.

For more information or if you have any questions about SMART Volume Spread Analysis (VSA) and our Software please visit the following link 
Smart Trader VSA (Volume Spread Analysis) Software you can also visit our Live and Free VSA (Volume Spread Analysis) Chat, Trading Rooms, and our other free volume spread analysis resource sites (linked below) to learn more.

For information on our real time, volume based trading alerts, Click here.

Good luck trading and see you in the chat (Links below).

Live Volume Spread Analysis (VSA) Trading Rooms, Chat, and Seminars:

Volume Spread Analysis (VSA) Social Networking Sites:
If you have any questions regarding Smart VSA or our software please visit our website (http://www.smartvsa.com) and submit a ticket using the support or contact link.

Thanks and see you in the chat.

Posted in Main

Smart Volume Analysis Trade Update (Combined 890 Pips): Trade Using Our Proprietary Visual Background Scanner and Smart Zone Levels For Signal Validation

Smart Volume Analysis Trade Update (Combined 890 Pips): Trade Using Our Proprietary Visual Background Scanner and Smart Zone Levels For Signal Validation


We have a flurry of new updates for the next release (Smart Volume Analysis Version 2.0).  I am going to be talking about two new framework modules in this article.  As many of you know from the live demos these new updates are very accurate and make Smart Volume Analysis Software even easier to use.  Two new modules for the next release we will be discussing here are our Proprietary Visual Background Scanner, and our new Proprietary Smart Zones Concept based in part on Supply Demand Zones. 

Many of you know my thoughts on standard VSA (many of you came to the same conclusions before finding Smart) and these new updates to our software bring our own Smart Volume Analysis to a whole new level and give our clients a renewed perspective on how to properly analyze volume.  We are now free of the contradictory nature of the “old way” and as a benefit, our volume analysis is far more accurate than any other volume analysis software.


When using these new tools in conjunction with Smart Volume Analysis Signals you can see from the following chart you were on the right side of each trade for the entire move down in EURUSD (890 Pips)


These examples are not cherry picked, the screenshots included in this article are real World examples selected from all of the charts I watch where the signal(s) and or concepts being discussed appeared at the time this article was written.


If you have any questions please refer to the links at the bottom of this article.


[screenshot]


Smart_volume_analysis_trading_


[text from screenshot]


Smart Volume Analysis Trade Update (Combined 890 Pips on EUR USD): Trade Using Our Proprietary Visual Background Scanner and Smart Zone Levels For Signal Validation


1. Proprietary Visual Background Scanner Weakness Indication (Hollow Red Circle)
2. First Weakness Signal – Smart Upthrust (Red) After VBS Change (Entry #1)
3. Reverse Upthrust (Blue) Strength and No Selling Pressure (Pale Yellow) Strength but Counter to VBS (No Trade)
4. Same as #3
5. Unconfirmed No Demand (Pink) Weakness and No Demand (Confirmed) (Entry #2 or simply hold initial)
6. Price Breaks Back Into Smart Zone (Red Line Upper Level) and falls straight through.
7. Exit when price hits the bottom of the Smart Zone (Blue Line Lower Level) (550+ Pips)
8. Proprietary Visual Background Scanner Weakness (Hollow Red Circle) Combined with Reverse Shakeout (Lite Gray) Entry #1
(We do have a Visual Background Scanner Strength Indication (Hollow Blue Circle) but no strength signal – no trade)
9. Close at Lower High Volume Zone (Green Areas) and Strength Indication (Proprietary Smart Buying)
10. New Proprietary Visual Background Scanner Weakness Indication (Hollow Red Circle) NO Weakness Signal No New Trade


Each VSA signal and indication within our software has it’s own color.  SMART Trader itself is painting these colors which makes these patterns and setups much easier to see and act on.  Using Smart VSA you can profit from these examples day in, and day out.  There is no guesswork.  If a signal is shown, it is valid.  It really is that simple.


Trade setups are verified using our proprietary visual background scanners and EOM concept module which are included with the system.


For more information or if you have any questions about SMART Volume Spread Analysis (VSA) and our Software please visit the following link
Smart Trader VSA (Volume Spread Analysis) Software you can also visit our Live and Free VSA (Volume Spread Analysis) Chat, Trading Rooms, and our other free volume spread analysis resource sites (linked below) to learn more.


For information on our real time, volume based trading alerts, Click here.


Good luck trading and see you in the chat (Links below).


Live Volume Spread Analysis (VSA) Trading Rooms, Chat, and Seminars:


Volume Spread Analysis (VSA) Social Networking Sites:
If you have any questions regarding Smart VSA or our software please visit our website (http://www.smartvsa.com) and submit a ticket using the support or contact link.


Thanks and see you in the chat.


Posted in Main

Smart Volume Spread Analysis on Multiple Charts and in Real Time (Video)

Join us for the future of Volume Spread Analysis.

Live Video Hangout is Online: http://goo.gl/Oo3Zt

We are demonstrating some of our newest test modules including Volume Based Support and Resistance HVZ, Smart Volume which does away with averaging and is far more accurate, Smart Buying, and Smart Selling etc.

If it's full keep on trying as people come and go all day.  Good luck trading and see you there.

Posted in Main