Retry: E-Mini (ES) Signal To Signal On H1 Using SMART Volume Spread Analysis Software

Some people couldn’t see the screenshot in the original post so I am trying it again.  Please let me know via the chat if it still doesn’t show up.


Hello all, sorry for the lack of posting.  I have been busy with some external (yet related) projects.
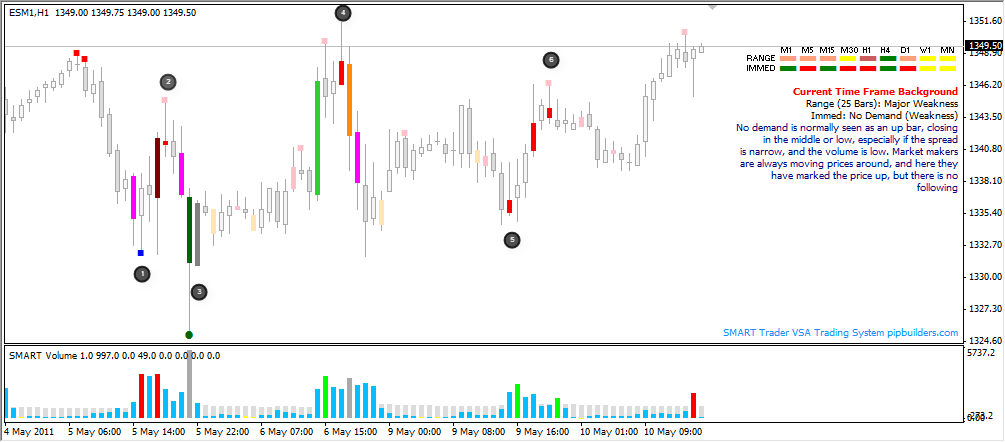
Today we have another great example of SMART VSA (Volume Spread Analysis) software in action on the E-mini.  The signals are noted using numbers within the chart and the comments are below the screenshot.  Trades noted (with number one being the exception) are what I call “tradeable” signals as per SMART, background, range etc. and taken in non dz’s.
This chart really illustrates how easy trading with SMART can be…
Which reminds me, the project featuring my daughters is moving along very nicely.  Their account has just about doubled since starting (a few weeks ago) Not bad for a couple of kids.  Please note I have limited their trading to the EUR/USD and the ESM1 (E-mini June) only.
In regards to the screenshot, these examples are not cherry picked, the screenshots are real World examples selected from all of the charts I watch where the signal(s) and or concepts being discussed have appeared at the time this article was written.


E-Mini (ES) Signal To Signal On H1 Using SMART Volume Spread Analysis Software


  1. Strength coming in after a dz (SMART VSA Strength Indication – Blue Square Potential Strength)
  2. Weakness and a SMART VSA Red Bar (Valid Upthrust – Weakness)
  3. SMART RTHFC (SMART VSA Green Bar) followed by a Shakeout (SMART VSA Gray Bar – Strength)
  4. SMART VSA Red Bar (Valid Upthrust at a top for range – Very Weak)
  5. SMART VSA Hidden Buying Bar (Custom Color Coming Soon) Excellent Strength Signal.
  6. Same as #2


There you have it. Pretty neat huh?.


Please keep in mind SMART Trader itself is painting these bars (and will only paint valid signals) which makes these patterns and setups much easier to spot and act on.  There is no guesswork.
These patterns repeat themselves day in and day out and using SMART you can clearly see not only standard VSA signals but our advanced multibar SMART VSA patterns as well.


Trade setups are verified using our proprietary background scanners (included with the system).


For more information or if you have any questions about SMART Trader Volume Spread Analysis (VSA) Software please visit 

SMART Trader at pipbuilders.com or visit our Live and Free VSA (Volume Spread Analysis) Chat and Trading Room at http://vsa.pipbuilders.com


If you would like to receive real time trade alerts Click here


Good luck trading and see you in the chat.


Posted in Main

E-Mini (ES) Signal To Signal On H1 Using SMART Volume Spread Analysis Software

Hello all, sorry for the lack of posting.  I have been busy with some external (yet related) projects.


Today we have another great example of SMART VSA (Volume Spread Analysis) software in action on the E-mini.  The signals are noted using numbers within the chart and the comments are below the screenshot.  Trades noted (with number one being the exception) are what I call “tradeable” signals as per SMART, background, range etc. and taken in non dz’s.


This chart really illustrates how easy trading with SMART can be…
Which reminds me, the project featuring my daughters is moving along very nicely.  Their account has just about doubled since starting (a few weeks ago) Not bad for a couple of kids.  Please note I have limited their trading to the EUR/USD and the ESM1 (E-mini June) only.


In regards to the screenshot, these examples are not cherry picked, the screenshots are real World examples selected from all of the charts I watch where the signal(s) and or concepts being discussed have appeared at the time this article was written.


es-h1-signal-to-signal.png


  1. Strength coming in after a dz (SMART VSA Strength Indication – Blue Square Potential Strength)
  2. Weakness and a SMART VSA Red Bar (Valid Upthrust – Weakness)
  3. SMART RTHFC (SMART VSA Green Bar) followed by a Shakeout (SMART VSA Gray Bar – Strength)
  4. SMART VSA Red Bar (Valid Upthrust at a top for range – Very Weak)
  5. SMART VSA Hidden Buying Bar (Custom Color Coming Soon) Excellent Strength Signal.
  6. Same as #2
There you have it. Pretty neat huh?.


Please keep in mind SMART Trader itself is painting these bars (and will only paint valid signals) which makes these patterns and setups much easier to spot and act on.  There is no guesswork.


These patterns repeat themselves day in and day out and using SMART you can clearly see not only standard VSA signals but our advanced multibar SMART VSA patterns as well.

Trade setups are verified using our proprietary background scanners (included with the system).
For more information or if you have any questions about SMART Trader Volume Spread Analysis (VSA) Software please visit
SMART Trader at pipbuilders.com or visit our Live and Free VSA (Volume Spread Analysis) Chat and Trading Room at http://vsa.pipbuilders.com


If you would like to receive real time trade alerts click here


Good luck trading and see you in the chat.


Posted in Main

Last Call…

It's been a long time since I've upated here on SMART (Behind the scenes) stuff.

We are fast approaching our goal of licensed SMART installations (Cheers) and will likely be stopping sales to focus on finishing the porting to a stand alone version (a free upgrade to existing clients) at that point.

The stand alone will likely be priced a bit higher than our current version so your chances to own it on the cheap are evaporating. Nothing is etched in stone in terms of pricing but most SMART users report recouping their money very quickly (usually within days) and after nearly a year of sales we have only had 6 refund requests which I think is a fitting testament to how worthwhile a bump in the price of the software is.

For more information or if you have any questions about SMART Trader Volume Spread Analysis (VSA) Software please visit 
SMART Trader at here or visit our Live and Free VSA (Volume Spread Analysis) Chat and Trading Room here

For information about our coming Forex and E-mini Real Time Alert Service click here

Good luck trading and see you in the chat.

Posted in Main

Beta For Real Time Volume Spread Analysis Trade Alerts Is Coming…

We had some issues with our beta VSA Real Time Trade Alerts signup page so please sign up again.  If you would like a notification of when it's ready, sign up at the following link: http://goo.gl/YnPl7

Thanks.

For more information or if you have any questions about SMART Trader Volume Spread Analysis (VSA) Software please visit 
SMART Trader at pipbuilders.com or visit our Live and Free VSA (Volume Spread Analysis) Chat and Trading Room at http://vsa.pipbuilders.com

If you would like to receive real time trade alerts sign up here

Good luck trading and see you in the chat.
PS Check out our friends at TradeTakers (A social network for Traders)

Posted in Main

SMART Volume Spread Analysis Software (Strength or Weakness Module)

Note:  To avoid confusion please note this was an older post which for some reason was not posted but rather saved as a draft.  As such the charts while relevant at the time are at different prices from current levels.


The proprietary SMART Volume Spread Analysis Software Strength or Weakness (AKA SOW not to be confused with Sign Of Weakness) Indication like many of the modules in SMART is just that… an indication… it shows whether there is strength or weakness in the background on a particular chart.  It has the additional benefit of determining whether supply or demand is present as well. 

A lot of the newer SMART Volume Spread Analysis Software users get into the habit of trying to trade every signal as if each is a tradeable event.  A number of the signals (detailed extensively in the live chat and here) are most definitely tradeable, and it’s not to say that the other patterns/signals aren’t important but that they should be treated as indications of strength and weakness and what is likely to happen rather than what will happen.


The SMART Strength or Weakness Module however has the distinction of being both an indication of strength or weakness and a tradeable signal.  Please read on.


We are only going to focus on the Strength and Demand indications within the SMART SOW module (Noted by blue and green square icons on the chart) as the reverse signals (Pink and red) do not react in the same manner. (Not enough to warrant discussion here anyway)


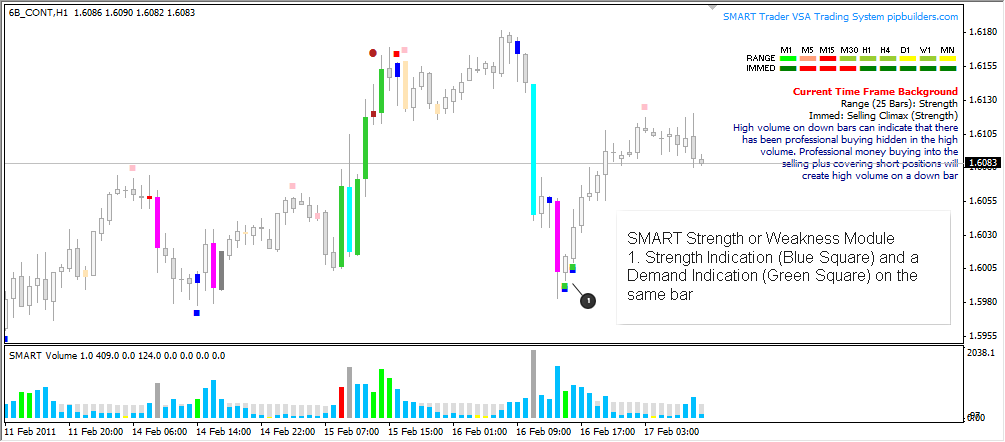
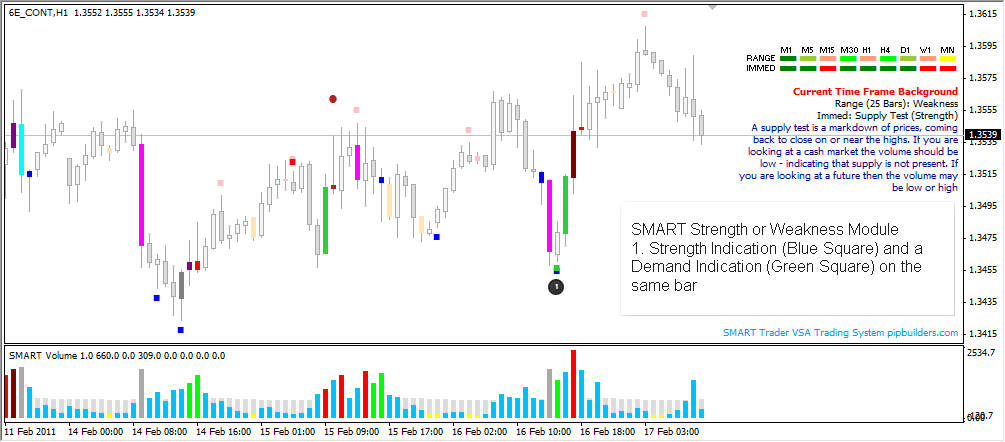
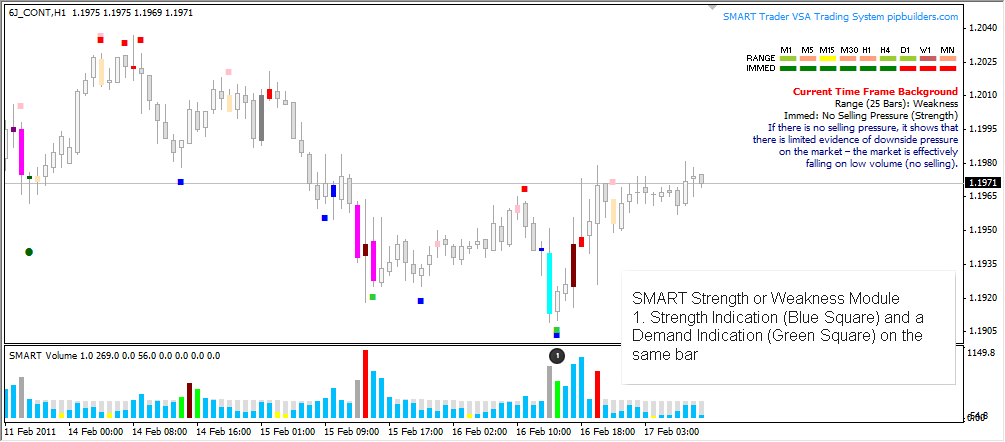
The signals within the SOW module come from proprietary code within our background scanners as well as supply and demand scanners within the module itself.  Normally on a single blue square (strength) I would say it’s just an indication and should not be traded solely because it has appeared.  The same goes for the green square (Demand) but when strength and demand indications occur on the same candle/bar it is quite different as the following examples will demonstrate.


I often say how easy SMART makes it to see/read what is really happening on the charts in real time and here is a perfect example. Take a look at the following charts and you should immediately be able to see the pattern we are discussing (Be aware of volume as well as these all occur within non dead zones (except one) You can see very easily how single blue squares react but more importantly how the price reacts when both supply and demand indications appear on the same candle/bar


Please keep in mind that these examples are not cherry picked, they are real World examples selected from all of the charts I watch where the signal(s) and or concepts being discussed have appeared at the time this article was written.


Example: SMART Volume Spread Analysis Software Globex H1 Aussie


SMART-Strength-or-Weakness-Example-Setup-01


Example: SMART Volume Spread Analysis Software Globex H1 British Pound


SMART-Strength-or-Weakness-Example-Setup-01.png


Example: SMART Volume Spread Analysis Software Globex H1 Euro


SMART-Strength-or-Weakness-Example-Setup-03


Example: SMART Volume Spread Analysis Software Globex H1 Japanese Yen


SMART-Strength-or-Weakness-Example-Setup-04


Please also keep in mind SMART Trader itself is painting these bars which makes these patterns and setups much easier to spot and act on.  There is no guesswork,  if a signal is painted it is valid.


These patterns repeat themselves day in and day out and using SMART you can clearly see not only standard VSA signals but our advanced multibar SMART VSA patterns as well.

Trade setups are verified using our proprietary background scanners (included with the system).
For more information or if you have any questions about SMART Trader Volume Spread Analysis (VSA) Software please visit
SMART Trader at pipbuilders.com or visit our Live and Free VSA (Volume Spread Analysis) Chat and Trading Room at http://vsa.pipbuilders.com


If you would like to receive real time Forex and ES Mini trade alerts sign up here


Good luck trading and see you in the chat.
 

PS Check out our friends at TradeTakers (A social network for Traders)
Posted in Main

22 Points On The ES Mini Using SMART Volume Spread Analysis Software

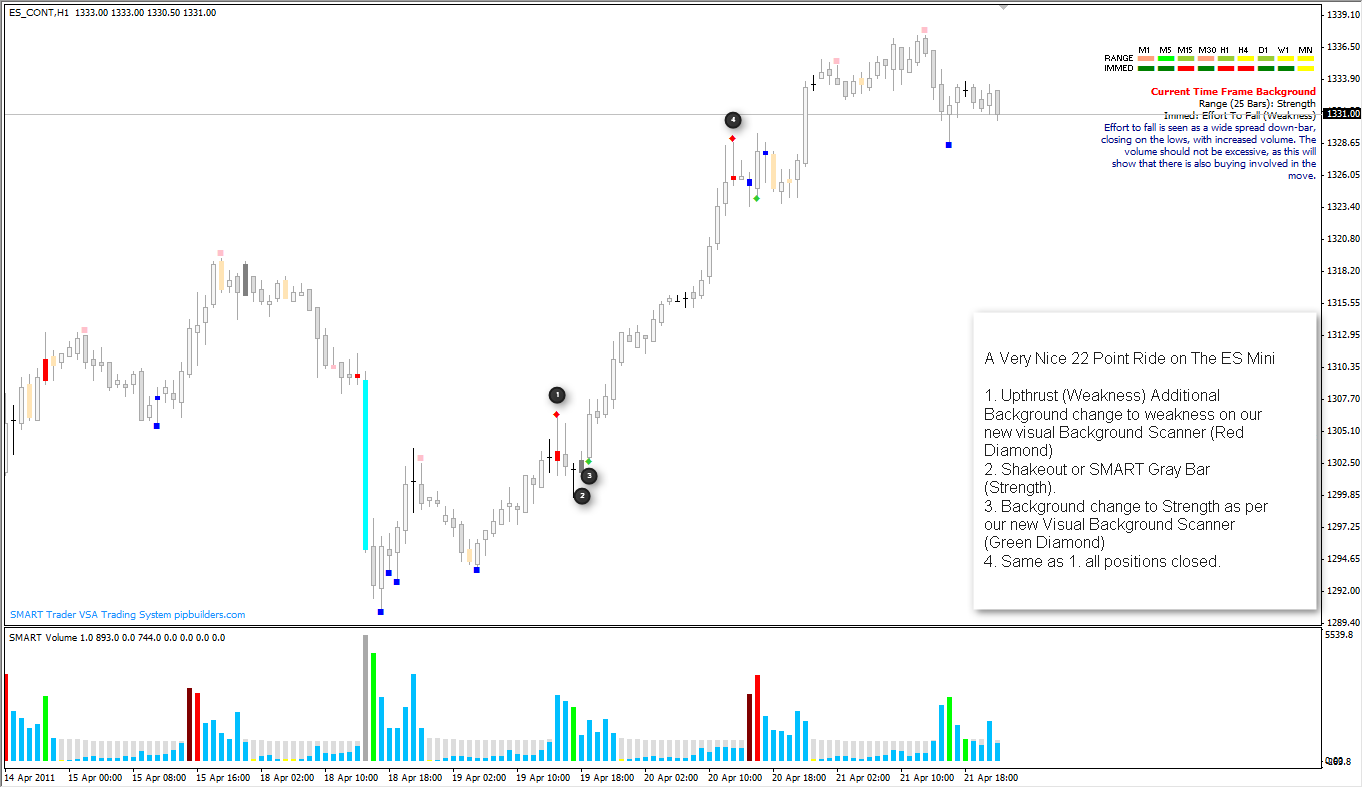
Here is an excellent example of SMART in action on the ES Mini.  Using some very simple tools within SMART Volume Spread Analysis Software you could have grabbed a nice 22 pip ride on the ES Mini using a Standard VSA pattern (Shakeout) and Our Proprietary Visual Background Scanners (Which are coming in a future update).


For those not in the chat and not aware of my calls/stats for the past week… Forex was +1824 pips, and ES was +1495 (Pip Equivalent), and my Daughters (Who I am training for the “SMART VSA, So easy an 8 year old can do it” project) are at 796 pips.


Please keep in mind that these examples are not cherry picked, the screenshots are real World examples selected from all of the charts I watch where the signal(s) and or concepts being discussed have appeared at the time this article was written.


22 Points On The ES Mini Using SMART Volume Spread Analysis Software - A Very Nice 22 Point Ride on The ES Mini


Text from screenshot:


A Very Nice 22 Point Ride on The ES Mini


1. Upthrust (Weakness) Additional Background change to weakness on our new visual Background Scanner (Red Diamond)
2. Shakeout or SMART Gray Bar (Strength).
3. Background change to Strength as per our new Visual Background Scanner (Green Diamond)
4. Back to an Upthrust (Weakness) Additional Background change to weakness on our new visual Background Scanner (Red Diamond) For a full 22ish point ride


Please also keep in mind SMART Trader itself is painting these bars which makes these patterns and setups much easier to spot and act on.  There is no guesswork,  if a signal is painted it is valid.
These patterns repeat themselves day in and day out and using SMART you can clearly see not only standard VSA signals but our advanced multibar SMART VSA patterns as well.
Trade setups are verified using our proprietary background scanners (included with the system).
For more information or if you have any questions about SMART Trader Volume Spread Analysis (VSA) Software please visit
SMART Trader at pipbuilders.com or visit our Live and Free VSA (Volume Spread Analysis) Chat and Trading Room at http://vsa.pipbuilders.com


If you would like to receive real time ES Mini trade alerts sign up here


Good luck trading and see you in the chat.
 

PS Check out our friends at TradeTakers (A social network for Traders)


Posted in Main

Our thoughts go out to our clients and friends in Japan

Our thoughts go out to our clients and friends and to all of those affected by the earthquake in Japan.
Posted in Main

Real Time Trade Alerts?

A large number of users have suggested creating a better system for the trade calls made by myself and others in the chat room.  I am all for creating such a system but would like to gauge the potential interest before investing much time in it.

If you are interested in real time trade alerts by myself and other seasoned Volume Spread Analysis traders from the group trading room, please indicate your interest at the link below.

If you would like to receive real time trade alerts sign up here

Good luck trading and see you in the chat.
PS Check out our friends at TradeTakers (A social network for Traders)

Posted in Main

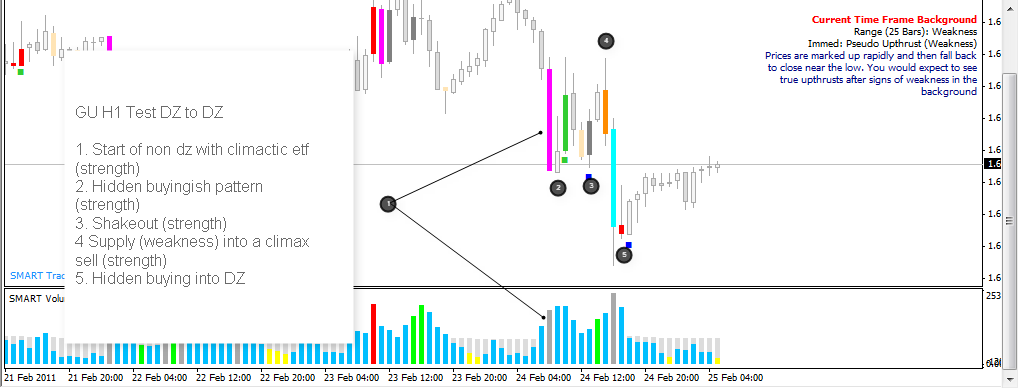
Smart Volume Spread Analysis Software Signal to Signal Trading (GBP/USD)

A quick chart detailing very simple signal to signal trading on GBP/USD from the end of one dead zone (no trade area) to the start of the next.  A simple one bar test (h1 test doc coming soon) was used as well for each entry.  You see this day in and day out very easily with SMART Volume Spread Analysis Software.


Please keep in mind that these examples are not cherry picked, the screenshots are real World examples selected from all of the charts I watch where the signal(s) and or concepts being discussed have appeared at the time this article was written.


2011-02-24_2319.png


Please also keep in mind SMART Trader itself is painting these bars which makes these patterns and setups much easier to spot and act on.  There is no guesswork,  if a signal is painted it is valid.


These patterns repeat themselves day in and day out and using SMART you can clearly see not only standard VSA signals but our advanced multibar SMART VSA patterns as well.
Trade setups are verified using our proprietary background scanners (included with the system).
For more information or if you have any questions about SMART Trader Volume Spread Analysis (VSA) Software please visit
SMART Trader at pipbuilders.com or visit our Live and Free VSA (Volume Spread Analysis) Chat and Trading Room at http://vsa.pipbuilders.com


Good luck trading and see you in the chat.
 

PS Check out our friends at TradeTakers (A social network for Traders)
Posted in Main

Multiple Time Frame Analysis Article Excerpt

An excerpt from an article written by the Great One regarding some common trading mistakes made by most non VSA (and even some VSA) traders.

Multiple Time Frame Analysis

In my years as a trading educator I have found that most losing traders have a critical glaring weakness in their approach to analyzing a market. The majority of their focus is placed on mathematical technical analysis tools such as moving average convergence divergence (MACD), the relative strength index (RSI) and/or stochastic studies (among many others). All of these types of tools are derivatives of price movement and are lagging indicators. To make matters worse, many of these traders attempt to use these tools in isolation and they completely lose focus on reality; indicators don’t move price, price movement moves indicators! Then the nail in the coffin occurs when the trader uses this approach on only one or two time frames (i.e. a 1- and 3-minute chart or a 5- and 15- minute chart).

The problem with this approach is the trader is not focused on why the price is moving in the first place. Price moves occur because there is an imbalance of supply/demand in the marketplace and this imbalance is created from the activity of professional traders. These professionals are very cagey when it comes to disguising their true intentions and hiding their positions from the uninformed retail trader. The average retail trader doesn’t understand how to read a chart in order to determine the underlying strength or weakness in the market. Even for a trained VSA expert, it is nearly impossible to accurately forecast the near-term direction of a market by analyzing a single time frame; there just isn’t enough corroborating evidence if we only look at one or two time frames. Think of each singular time frame as a musical note, when we combine multiple time frame’s together we go from the market blaring out one note noises, to the market singing us a melody and revealing the message that is so often hidden to the trader who can’t read a chart; that message is where the professional traders are positioned. 
Before we move to our chart examples we must understand the following rules of multiple time frame analysis:

  1. Each time frame can and will look structurally different from another.
  2. The smaller time frame will lead the larger time frame.
  3. The combination of activity on the smaller time frames summed together creates the structure of the larger time frames.`
  4. The larger the time frame showing strength/weakness the larger the impending move.
  5. We use the larger time frame to confirm the smaller time frame’s message; if there is no corroboration we have no confirmation.

If you would like to see the rest of the article let me know in the chat.

We also have some pretty big news from one of our good friends in the chat coming soon.
For more information or if you have any questions about SMART Trader Volume Spread Analysis (VSA) Software please visit 
SMART Trader at pipbuilders.com or visit our Live and Free VSA (Volume Spread Analysis) Chat and Trading Room at http://vsa.pipbuilders.com

Good luck trading and see you in the chat.
Posted in Main