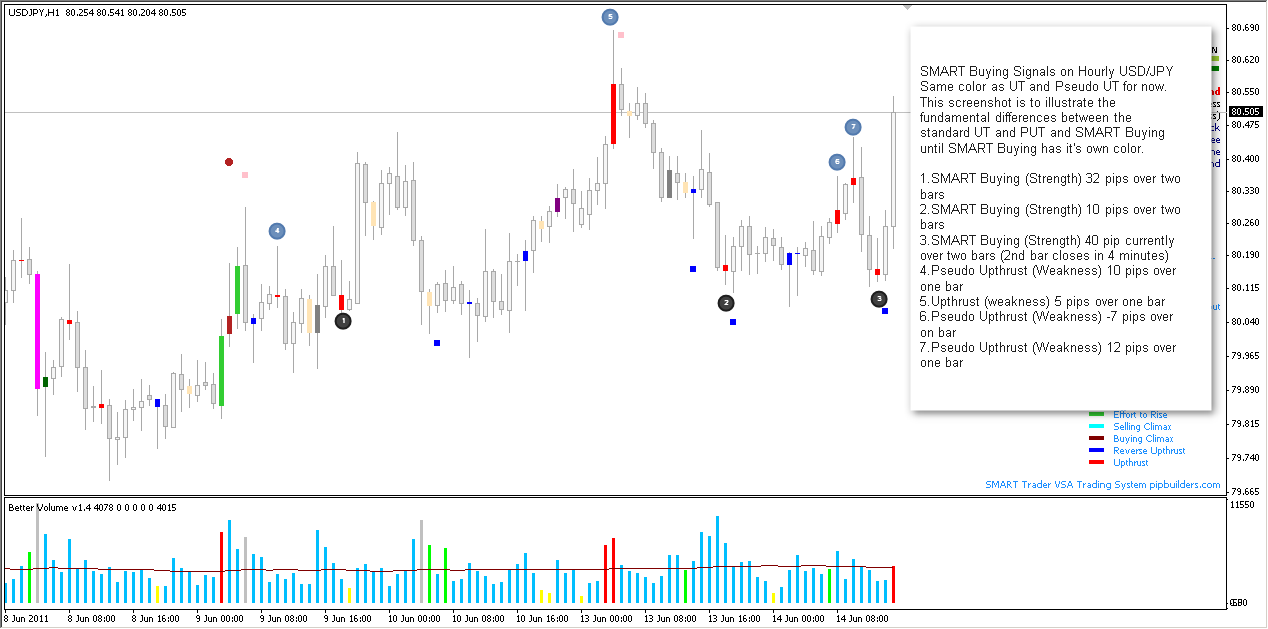
The following screenshot illustrates the differences between our own SMART VSA (Volume Spread Analysis Software) signal SMART Buying and the standard VSA signals: Upthrusts, and Pseudo Upthrusts (All have the same color for now and look similar)
Some users have some trouble seeing the differences between them since they all use the same color (This will be changed in the next update). SMART Buying is 1,2,3 and UT/PUT’s are the rest. As you can see the EOM’s are better on SMART Buying going two bars out while they are best done for one bar on Upthrusts and Pseudo Upthrusts.
If you have any questions visit us in our chatroom (Free) or our new facebook group.
Please keep in mind that these examples are not cherry picked, the screenshots are real World examples selected from all of the charts I watch where the signal(s) and or concepts being discussed have appeared at the time this article was written.
SMART Buying Signals on Hourly USD/JPY
Same color as UT and Pseudo UT for now.
This screenshot is to illustrate the fundamental differences between the standard UT and PUT and SMART Buying until SMART Buying has it’s own module.
1.SMART Buying (Strength) 32 pips over two bars
2.SMART Buying (Strength) 10 pips over two bars
3.SMART Buying (Strength) 40 pip currently over two bars (2nd bar closes in 4 minutes)
4.Pseudo Upthrust (Weakness) 10 pips over one bar
5.Upthrust (weakness) 5 pips over one bar
6.Pseudo Upthrust (Weakness) -7 pips over on bar
7.Pseudo Upthrust (Weakness) 12 pips over one bar
SMART Trader itself is painting these bars which makes these patterns and setups much easier to spot and act on. There is no guesswork, if a signal is painted it is valid.
The trades in this screenshot do not take into account Dead Zones or Active Volume Zones. Each signal discussed was annotated (I missed two on the chart due to the low resolution of my mini as they were off the screen so the total would have been about 20 pips higher). The pip totals reflect only the annotated signals. These charts and examples are not cherry picked.
These patterns repeat themselves day in and day out and using SMART you can clearly see not only standard VSA signals but our advanced multibar SMART VSA patterns as well.
Trade setups are verified using our proprietary background scanners (included with the system).
For more information or if you have any questions about SMART Trader Volume Spread Analysis (VSA) Software please visit
SMART Trader at pipbuilders.com or visit our Live and Free VSA (Volume Spread Analysis) Chat and Trading Room at http://vsa.pipbuilders.com
If you would like to receive real time trade alerts sign up here
Good luck trading and see you in the chat.
PS Check out our friends at TradeTakers (A social network for Traders)

