This article is about two “framework” modules included with our VSA software. One is named the Proprietary Visual Background Scanner, and the other is our Proprietary Smart Zones Concept based in part on Supply and Demand Zones.
Many of you know my thoughts on standard VSA (many of you came to the same conclusions before finding Smart) and these modules bring our Smart Volume Analysis tools to a whole new level and give our clients a renewed perspective on how to properly analyze volume. We are now free of the contradictory nature of the “old way” and as a benefit, our volume analysis is far more accurate than any other volume analysis software.
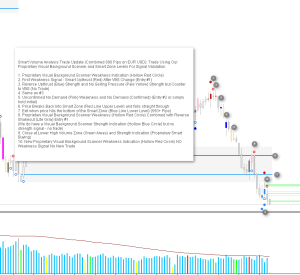
When using thesetools in conjunction with Smart Volume Analysis Signals you can see from the following chart you were on the right side of each trade for the entire move down in EURUSD (890 Pips)
These examples are not cherry picked, the screenshots included in this article are real World examples selected from all of the charts I watch where the signal(s) and or concepts being discussed appeared at the time this article was written.
If you have any questions please refer to the links at the bottom of this article.
[text from screenshot]
Smart Volume Analysis Trade Update (Combined 890 Pips on EUR USD): Trade Using Our Proprietary Visual Background Scanner and Smart Zone Levels For Signal Validation
1. Proprietary Visual Background Scanner Weakness Indication (Hollow Red Circle)
Each VSA signal and indication within our software has it’s own color. SMART Trader itself is painting these colors which makes these patterns and setups much easier to see and act on. Using Smart VSA you can profit from these examples day in, and day out. There is no guesswork. If a signal is shown, it is valid. It really is that simple.
Trade setups are verified using our proprietary visual background scanners and EOM concept module which are included with the system.
For more information or if you have any questions about SMART Volume Spread Analysis (VSA) and our Software please visit the following link
For information on our real time, volume based trading alerts, Click here.
If you have any questions regarding Smart VSA or our software please submit a ticket using the support link on our website (http://www.smartvsa.com)
Good luck trading and see you in the markets.
The post Smart Volume Analysis Trade Update (Combined 890 Pips): Trade Using Our Unique Visual Background Scanner and Smart Zone Levels For Trade Validation appeared first on Smart Trader.

