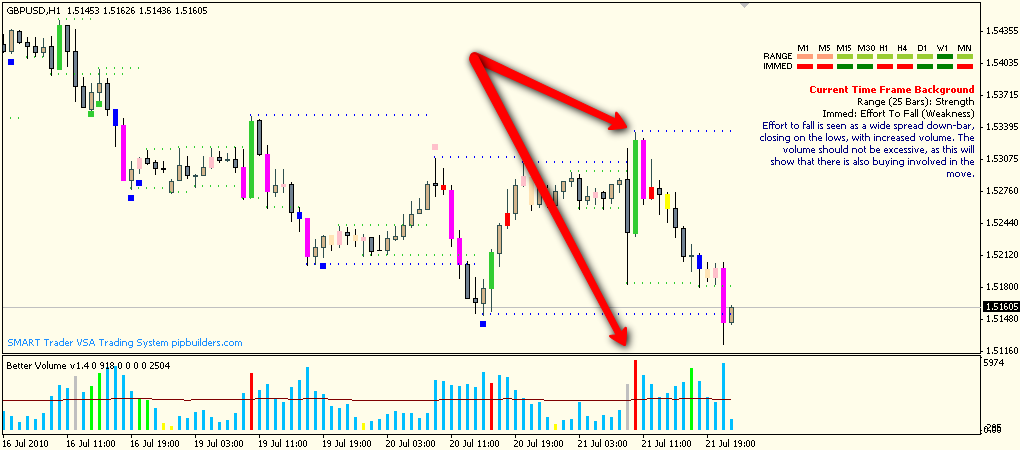
One of the great strengths of the SMART Trader (Volume Spread Analysis) Software is that it gives you the ability to recognize multi bar patterns you may not have otherwise seen such as the Mount Fuji Fakeout, The Spinning Rowboat, and the newest dubbed the Treehugging Fruitcake.
Here is a quick chart showing a SMART Green Bar (Effort To Rise) on Excessive Volume (Weakness) Into a SMART Pink Bar (Effort To Fall) on high but not excessive volume (Weakness).
I will test this further and see if it’s worthy of it’s own alert.
Sound alerts are done and the update should roll out tomorrow. The Spinning Rowboat Advanced Module is testing and may also make it in tomorrow’s update. A s you may be aware you are alerted of new updates via your chart but I will also post a message here and in the chat.
Please keep in mind SMART Trader itself is painting these bars which makes these patterns and setups much easier to spot and act on.
Trade setups are verified via our proprietary background scanners (included with the system).
For more information or if you have any questions about SMART Trader Volume Spread Analysis (VSA) Software please visit
Good luck trading.

